Typical ad-hoc analytical queries have to process much more data than can fit in memory. Consequently, those queries tend to be I/O bound. When the Analytics service was introduced in Couchbase 6.0, it allowed users to specify multiple “Analytics Disk Paths” during node initialization. In this article, we perform a couple of experiments on different instances in the cloud to show how to properly set up multiple “Analytics Disk Paths” and how this feature can be utilized to speed up Analytics queries.

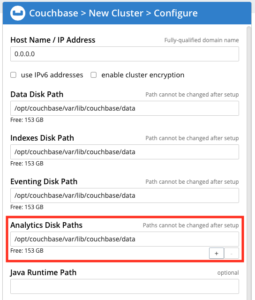
Figure 1: Specifying Analytics disk paths during node initialization
During node initialization, any unique file system path can be used as an “Analytics Disk Path” regardless of the actual physical storage device in which this path resides. Multiple paths that reside on the same device can be used. Data in the Analytics service is partitioned across all the specified “Analytics Disk Paths” in all nodes that have the Analytics service. For example, if a cluster has two nodes with the Analytics service and one of the nodes had 4 “Analytics Disk Paths” specified, and the other node had 8 “Analytics Disk Paths,” every created dataset in Analytics will have a total of 12 partitions (data partitions).
During query execution, Analytics’s MPP query engine attempts to concurrently read and process data from all data partitions. Because of that, the Input/Output Operations per Second (IOPS) of the actual physical disk in which each data partition resides plays a major role in determining the query execution time.
Modern storage devices such as SSDs have much higher IOPS and can deal better with concurrent reads than HDDs. Therefore, having a single data partition on devices with high IOPS will not fully utilize their capabilities. To simplify the setup of the typical case of a node having a single modern storage device, the Analytics service automatically creates multiple data partitions within the same storage device if and only if a single “Analytics Disk Path” is specified during the node initialization. The number of automatically created data partitions is based on this formula:
|
1 2 |
Maximum partitions to create = Min((Analytics Memory in MB / 1024), 16) Actual created partitions = Min(node virtual cores, Maximum partitions to create) |
For example, if a node has 8 virtual cores and the Analytics service was configured with memory >= 8GB, 8 data partitions will be created on that node. Similarly, if a node has 32 virtual cores and was configured with memory >= 16GB, only 16 partitions will be created since the maximum partitions to be automatically created have an upper limit of 16 partitions.
To show the performance impact on the number of data partitions per disk, we performed a couple of experiments on different instance types in Amazon Web Services EC2 using Couchbase Server 6.5 Beta 2. The data used in the experiments is a JSONified version of the famous TPC-DS data set where every row was converted into a JSON document with an additional field that identifies the name of the table to which the document belongs. Sample TPC-DS data was generated and loaded into a bucket called tpcds. In both experiments, the Analytics service was assigned 32GB of memory.
Experiment 1: Single instance with 8 virtual cores and 1 NVMe SSD
In this experiment, we created 3 datasets in the Analytics service as follows:
|
1 2 3 |
CREATE DATASET store_sales ON tpcds WHERE table_name='store_sales'; CREATE DATASET date_dim ON tpcds WHERE table_name='date_dim'; CREATE DATASET item ON tpcds WHERE table_name='item'; |
We used the following TPC-DS qualification query after converting it into an N1QL for Analytics query to measure the response time under two different configurations:
|
1 2 3 4 5 6 7 8 9 10 11 12 13 14 15 16 17 18 |
SELECT dt.d_year, item.i_brand_id brand_id, item.i_brand brand, sum(ss.ss_ext_sales_price) sum_agg FROM date_dim dt, store_sales ss, item WHERE dt.d_date_sk = ss.ss_sold_date_sk AND ss.ss_item_sk = item.i_item_sk AND item.i_manufact_id = 128 AND dt.d_moy=11 GROUP BY dt.d_year, item.i_brand, item.i_brand_id ORDER BY dt.d_year, sum_agg DESC, brand_id LIMIT 100; |
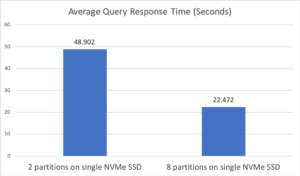
For the first configuration, we specified two “Analytics Disk Paths” on the same disk, which resulted in each dataset having 2 data partitions. As for the second configuration, only one “Analytics Data Paths” was specified, which triggered the automatic configuration option. Since the node has 8 virtual cores, 8 data partitions were automatically created. Figure 2 below shows the average query response times for these two configurations. In terms of average query response time, the automatic configuration with 8 partitions was more than twice as fast as the configuration with only 2 data partitions. This improvement was caused by better utilization of the single NVMe SSD, as this type of disk can handle 8 concurrent reads. In addition, since this query involves grouping and sorting, processing the data concurrently on 8 partitions resulted in a significant improvement in query performance.

Figure 2: Experiment 1 average query response time
Experiment 2: Single instance with 8 virtual cores and 6 HDDs
In this experiment, we will try to scan a larger volume of data by creating a single dataset that contains all the data in the tpcds bucket as follows:
|
1 |
CREATE DATASET tpcds on tpcds; |
We used the following N1QL for Analytics query that results in scanning all the data using two different configurations:
|
1 2 3 |
SELECT SUM(ss_ext_sales_price) FROM tpcds WHERE table_name = "store_sales"; |
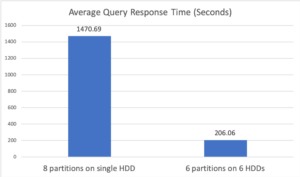
For the first configuration, a single “Analytics Data Paths” was specified; this resulted in the system automatically creating 8 partitions on a single HDD. In the second configuration, 6 “Analytics Data Paths” were specified and each path was located on a different physical HDD resulting in 6 data partitions. Figure 3 below shows the average query response time for the two configurations. In the first configuration, performing 8 concurrent reads on a single HDD resulted in poor performance. A major reason for this is that it left the I/O bandwidth of the other 5 HDDs unused. In addition, 8-way concurrency against a single HDD led to more disk arm movement, increasing the average cost of a disk I/O. The second configuration, which utilized all 6 HDDs concurrently, enjoyed a more than 7x performance improvement as a result.

Figure 3: Experiment 2 average query response time
Conclusion:
The Analytics engine is a full-fledged parallel query processor that supports parallel joins, aggregations, and sorting — based on “best of breed” algorithms drawn from 30+ years of relational MPP R&D — but for JSON data. Using two experiments, we showed the significant performance impact that can result from different choices made when configuring the “Analytics Disk Paths”. We also demonstrated how the Analytics engine can utilize multiple physical disks, when available, to significantly speed up Analytics queries.