1- Couchbase has a Restful API for Administrative tasks
Couchbase’s Web Console is just a consumer of the Administrative Restful API. As such, you can automate nearly any operation that would normally require you to log into the web console:
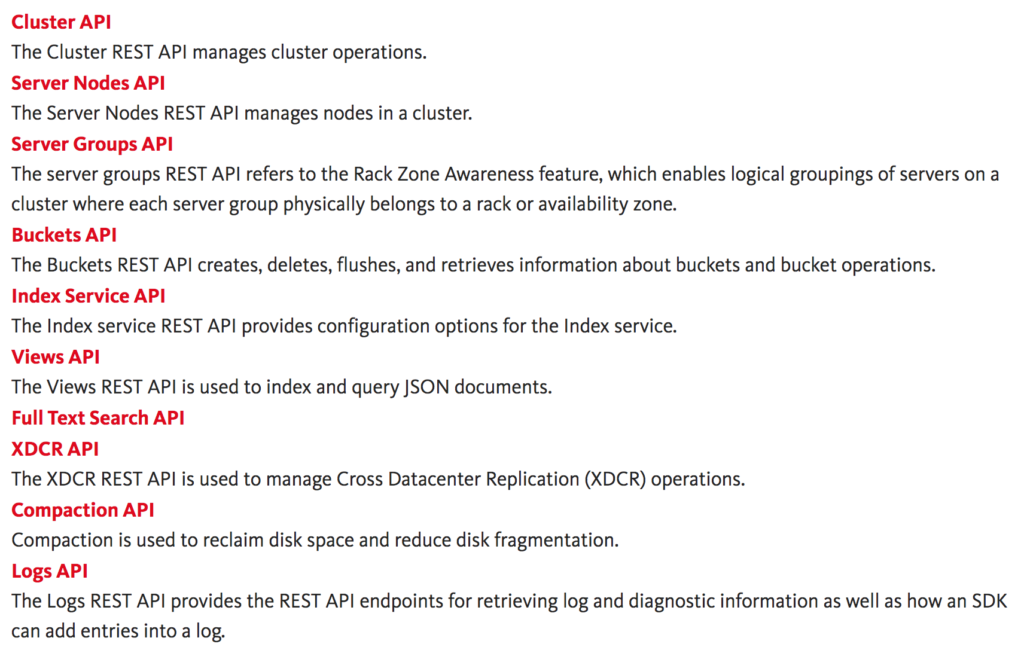
You can check the API documentation here
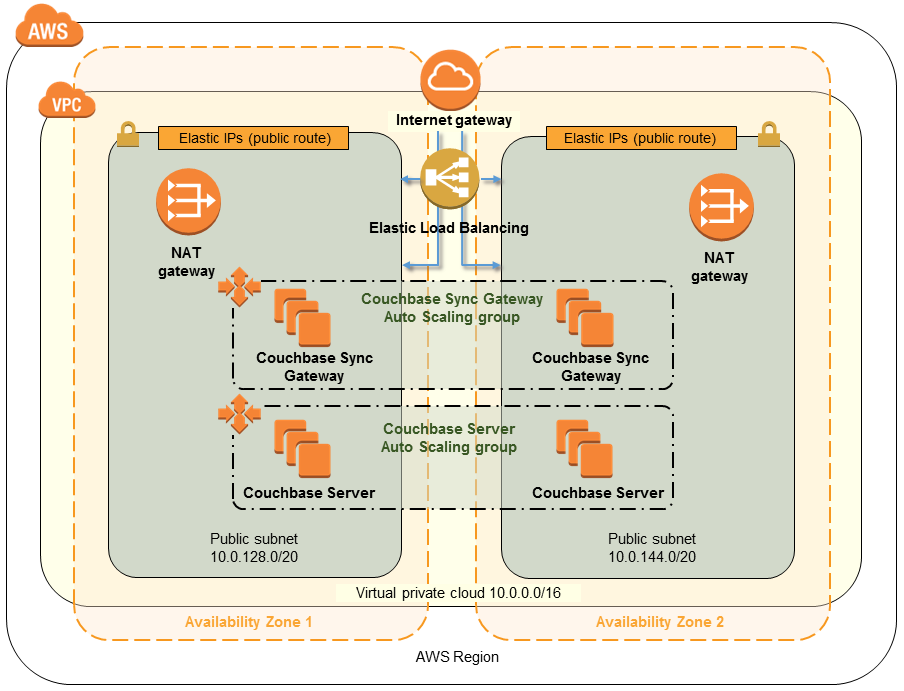
2- It can be quickly deployed on AWS
Couchbase can be easily installed in a bunch of platforms, or even on docker. But if you need a production level deployment, it can be quickly deployed via our Terraform template or via AWS QuickStart.
3- Can run on top of Kubernetes or Open Shift

Couchbase can be deployed on Kubernetes or OpenShift. It also comes with an Operator, which can automate a significant part of the infrastructure management, such as joining new nodes to the cluster, rebalancing data, consolidating logs, etc.
So far, developers are stuck between only two options: Managing their database by themselves or relying on a third party to do it for them. Kubernetes/OpenShift arises as a third option where you can automate most of the work necessary to maintain your database without losing the flexibility of fine-tuning it.
4- Couchbase can scale massively
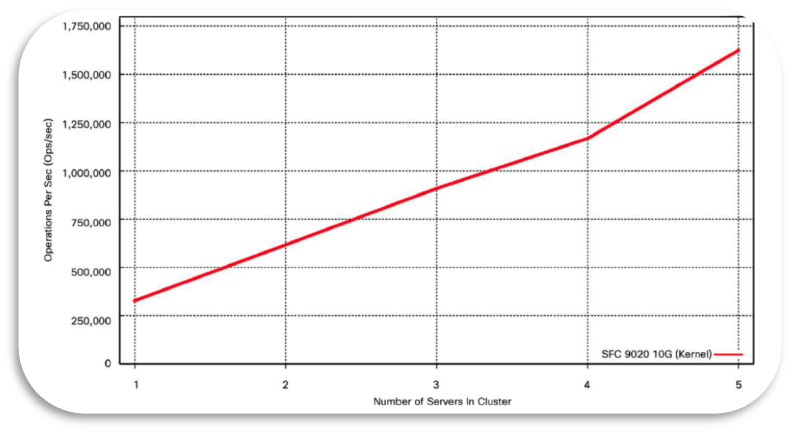
Unlike most of the databases you are familiar with, Couchbase is designed to scale to hundreds of nodes in the same cluster. It can combine high performance with linear scalability thanks to a variety architectural features: Transparent shards, multidimensional scaling, master-less architecture, Database Change Protocol, No single point of failure, etc.
5- You can create Full-Text Search Indexes
Most of the user-facing applications eventually need to implement some sort of advanced search. This kind of feature usually requires you to push data to a third-party tool like Solr or Elastic Search. However, adding such tools increases the cost and complexity of your infrastructure significantly, not to mention all the code necessary to push Object/Document changes to these tools.
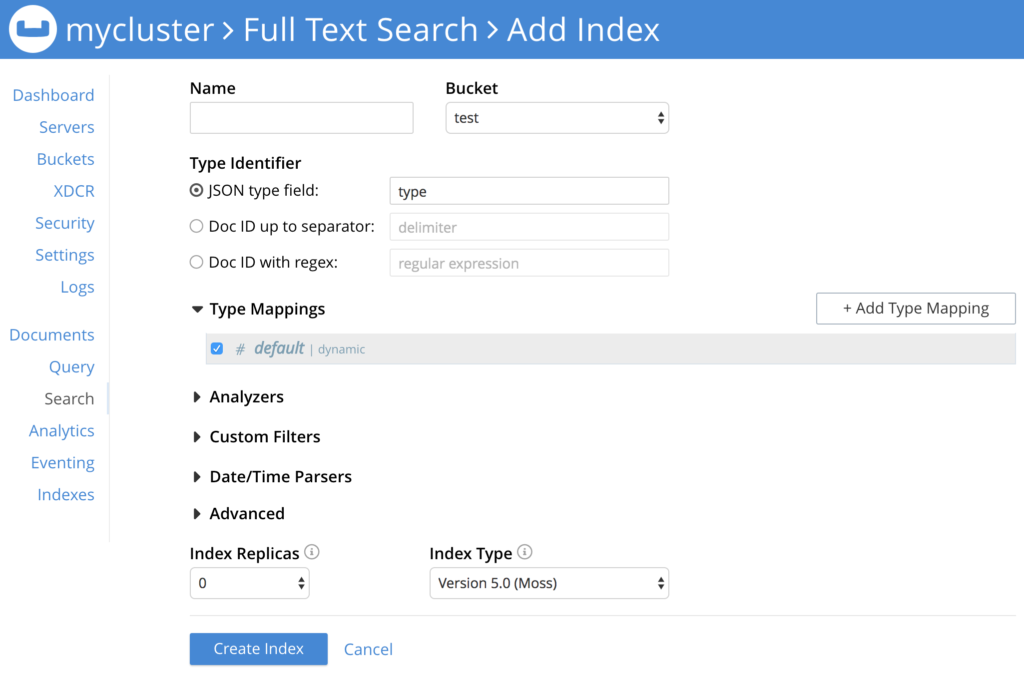
Starting with Couchbase 5.0, you can simply create full-text search index in the web console and start making full-text searches directly from the database:
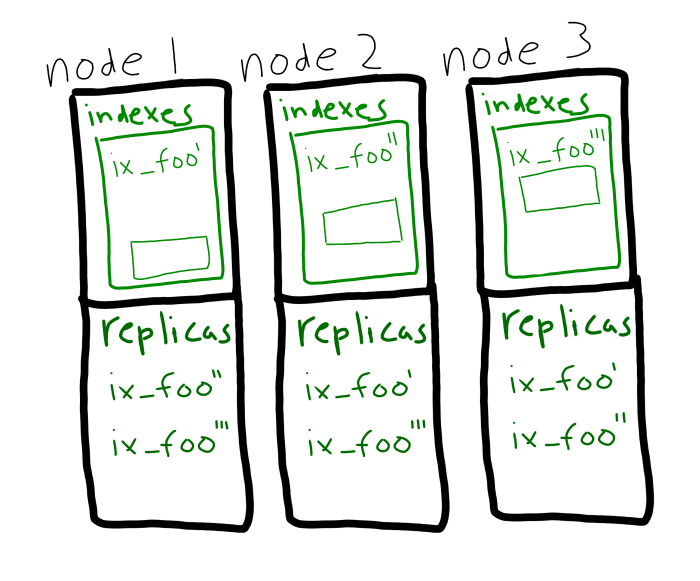
Additionally, there is also support for geospatial queries and partition/replicate your index:
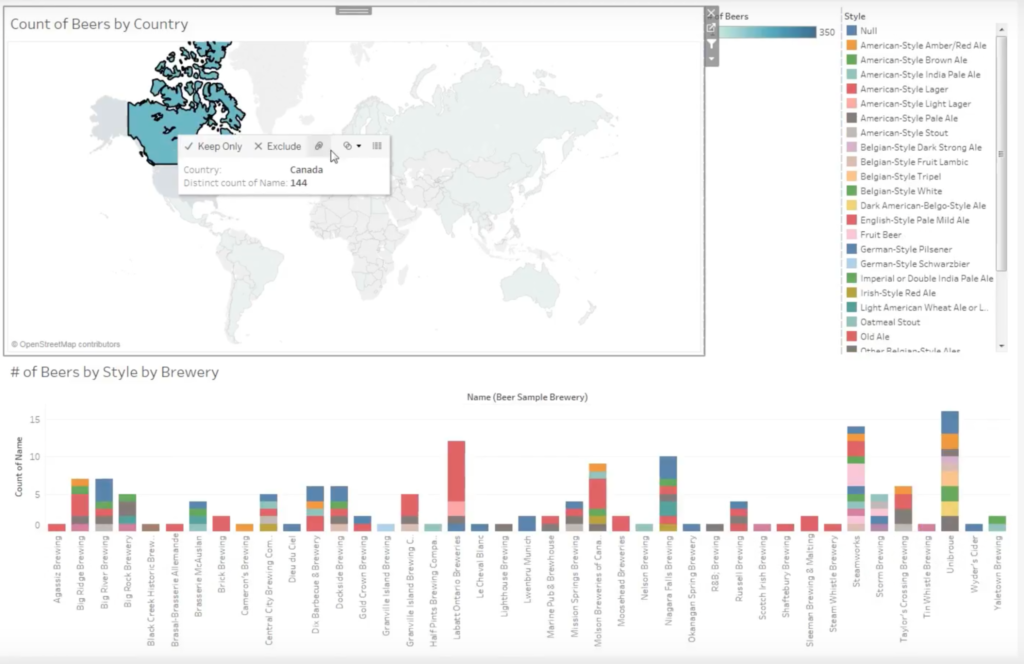
6- It can be easily plugged with a bunch of data visualization tools
One of the reasons why NoSQL databases failed in the past is that we don’t use the database just to store the data of our application, but also to run reports and analytics in it. That is one of the reasons why we have created N1QL, a very powerful SQL-like way to query a database.
But of course, querying the database is just half of the history. Most of the time, we also need to plot graphs, tendencies, create dashboards, etc. That is why you can connect Couchbase with a bunch of visualization tools such as Talend, Tableau, Knowi and many others.
If you need to generate huge reports but don’t want to impact your application performance, you should also consider our new Analytics Service.
7- It supports end-to-end Data Compression
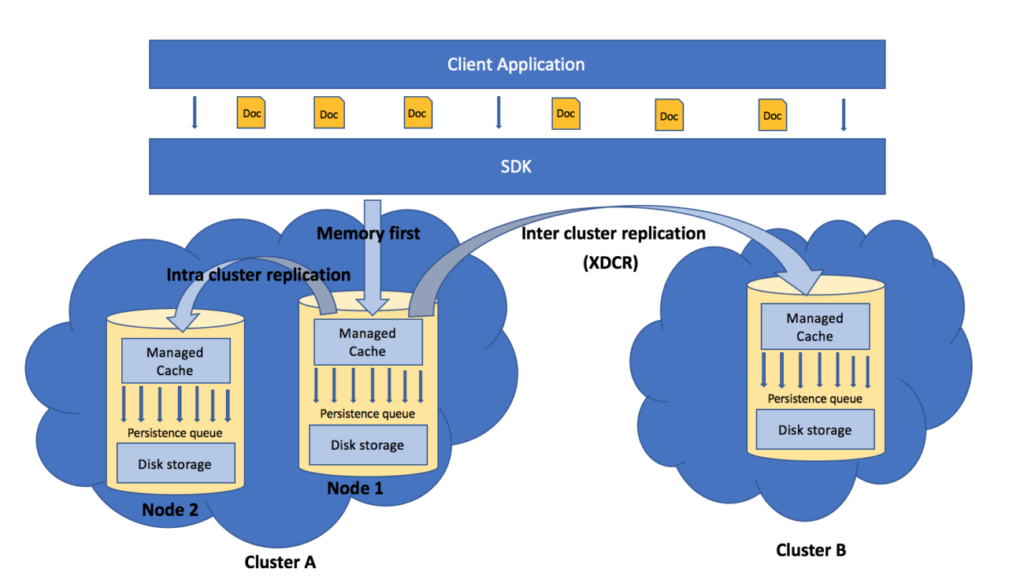
High network traffic, disk usage, and memory can cost a ton of money at the end of each month in most of the cloud providers. To address this issue, Couchbase supports an end-to-end compression, which allows data to remain compressed from the client to the cache, disk storage and to replicate data across data centers.
The figure below indicates the various stages within this data flow from the client application to storage where data is compressed.
If you want to read more about it, you can do it here.
8- Queries can be audited
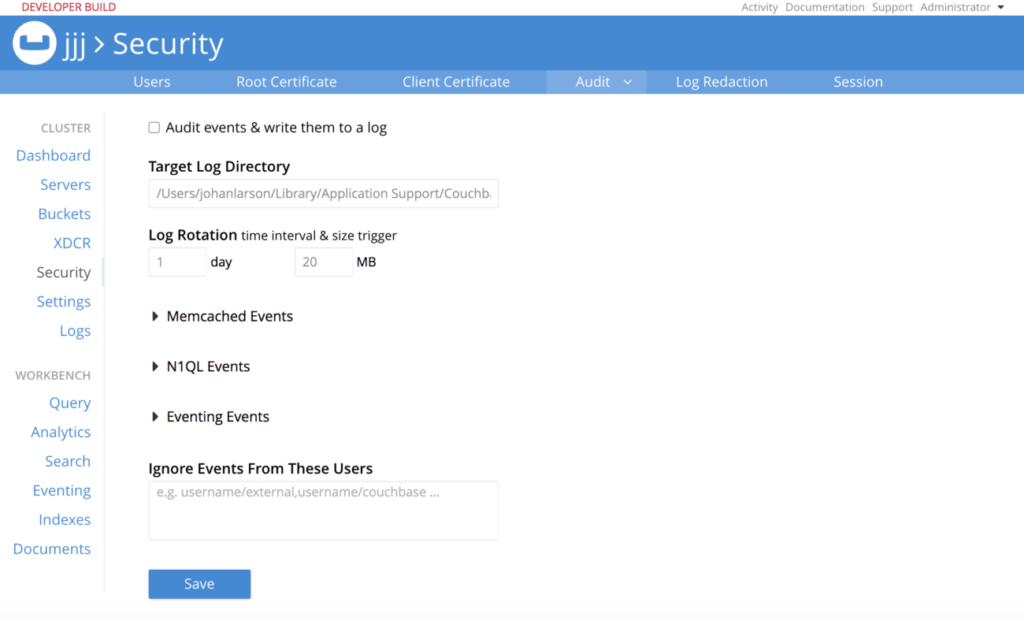
If the data you are storing is sensitive in some way, you might consider adding an extra layer of security by auditing the queries that are executed against certain documents. Auditing can be enabled via Security -> Audit:
You can also choose which types of events should be audited and which ones should not:
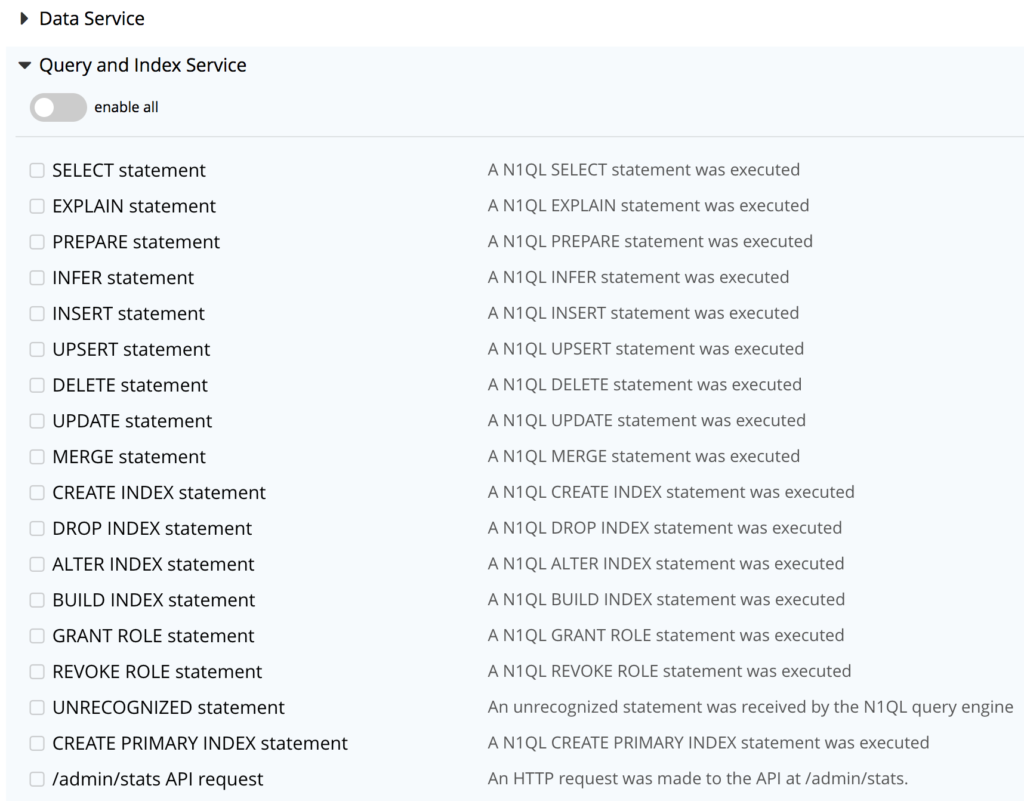
The log is saved in a file called audito.log within the directory you have specified. If you want to read more about it, please check this article.
9- Nodes can be configured to fail automatically
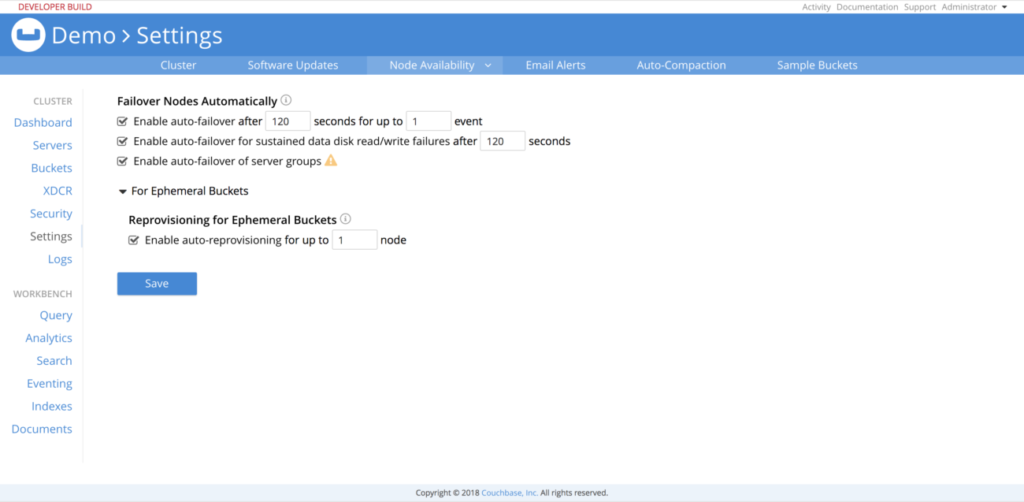
In distributed systems, slow nodes are sometimes more harmful than the ones that have failed completely. Recognizing those sluggish nodes is not a straightforward task if you are not watching all stats of your cluster closely. Since Couchbase 5.5, you can configure the cluster manager to automatically fail instances that are not working properly:
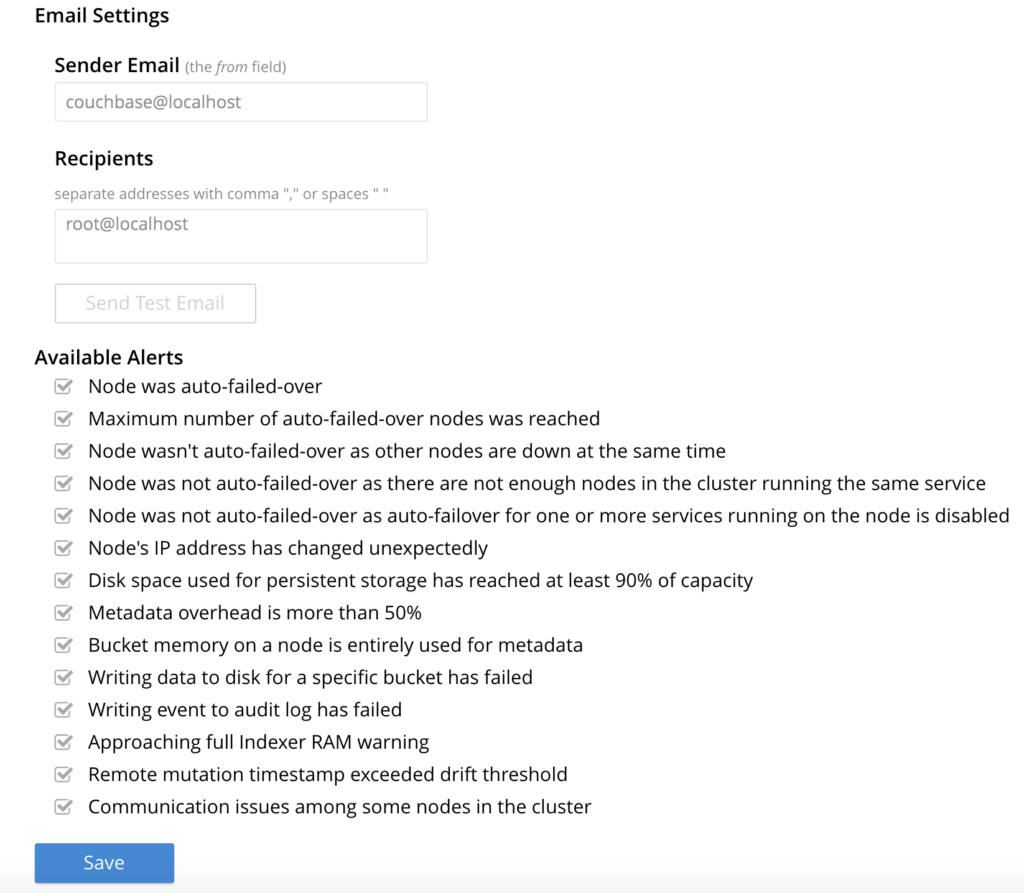
Additionally, you can define notifications in case of something else goes wrong:
Please refer to this article to learn more about auto-failover
10- Response Time Observability
We put a lot of our effort to make it easier for Devops/DBAs to identify problems in their clusters. Couchbase already has a set of diagnostic tools like the built-in metrics in the Java SDK, the advanced metrics and profile information in N1QL, or the thresholds and logging introduced in Couchbase Server 5.0.
But, since version 5.5, we have introduced a new capability called Response Time Observability which will provide to system deployers a very simple way to observe response times relative to a (tune-able) threshold.
This feature, which uses OpenTracing format, logs slow requests followed by a bunch of details about it after each time interval, so you can easily identify the operations with poor performance.
|
1 2 3 4 5 6 7 8 9 10 11 12 13 14 15 16 17 18 19 20 21 22 23 24 25 26 27 28 29 30 31 32 33 34 35 36 37 38 39 40 41 42 43 44 45 46 47 48 49 50 51 52 53 54 55 56 |
Apr 04, 2018 9:42:57 AM com.couchbase.client.core.tracing.ThresholdLogReporter logOverThreshold WARNING: Operations over threshold: [ { "top" : [ { "server_us" : 8, "local_id" : "41837B87B9B1C5D1/000000004746B9AA", "local_address" : "127.0.0.1:55011", "operation_id" : "get:0x6", "dispatch_us" : 315, "remote_address" : "127.0.0.1:11210", "total_us" : 576 }, { "server_us" : 8, "local_id" : "41837B87B9B1C5D1/000000004746B9AA", "local_address" : "127.0.0.1:55011", "operation_id" : "get:0x5", "dispatch_us" : 319, "remote_address" : "127.0.0.1:11210", "total_us" : 599 }, { "server_us" : 8, "local_id" : "41837B87B9B1C5D1/000000004746B9AA", "local_address" : "127.0.0.1:55011", "operation_id" : "get:0x4", "dispatch_us" : 332, "remote_address" : "127.0.0.1:11210", "total_us" : 632 }, { "server_us" : 11, "local_id" : "41837B87B9B1C5D1/000000004746B9AA", "local_address" : "127.0.0.1:55011", "operation_id" : "get:0x3", "dispatch_us" : 392, "remote_address" : "127.0.0.1:11210", "total_us" : 762 }, { "server_us" : 23, "local_id" : "41837B87B9B1C5D1/000000004746B9AA", "local_address" : "127.0.0.1:55011", "operation_id" : "get:0x1", "decode_us" : 9579, "dispatch_us" : 947, "remote_address" : "127.0.0.1:11210", "total_us" : 16533 }, { "server_us" : 56, "encode_us" : 12296, "local_id" : "41837B87B9B1C5D1/000000004746B9AA", "local_address" : "127.0.0.1:55011", "operation_id" : "upsert:0x2", "dispatch_us" : 1280, "remote_address" : "127.0.0.1:11210", "total_us" : 20935 } ], "service" : "kv", "count" : 6 } ] |
Response Time Observability is on by default, and we have already defined a set of thresholds to avoid logging healthy requests. If you want to push the limits of your cluster, you can even set smaller thresholds manually. You can read more about it here.
