This blog covers how to set up a Couchbase Analytics cluster in under 5 clicks and create a real-time visualization dashboard with Tableau.
Introduction
Couchbase Server is a hybrid NoSQL database that supports operational and analytical workloads. Couchbase Analytics in Couchbase Server 6.0 brings “NoETL for NoSQL”, enabling users to run ad-hoc analytical queries on JSON data in their natural form – without the need for transformation or schema design – by leveraging a massively parallel processing (MPP) query engine.
Every enterprise has already invested in a visualization tool and therefore has a critical need to leverage existing investments. This includes not only tooling but also skillsets and training of business reporting and dash-boarding teams.
I’ve always believed that the proof is in the proverbial pudding when it comes to analyzing and visualizing JSON data in real-time. In the next section, I’ll showcase how Couchbase solves this challenge.
Demo scenario
Let me give you the Couchbase Analytics scenario that I demo’d during Couchbase Connect 2018 for the architecture keynote:
Imagine a fictitious company managing a fleet of cars where each car in the fleet sends operational data to its “mothership”. The operations team can monitor the incoming data being sent by the cars while in transit and have system alerts configured for any faults in critical indicator readings.
The challenges the operations team would want to solve might include:
1. How to analyze the incoming data without impacting the ability of the cars to send data
2. How to use a Tableau visualization tool to create a real-time dashboard of the situation on the ground
Data model

As a part of the demo, I created a JSON data model to represent real-time information being sent by each car on the road. As is the case with most JSON data models, nested objects and arrays are very much a part of the data being sent back to the car. For example, I have modeled the tire pressure readings as an array: if the fictitious car company started manufacturing bikes with 2 wheels or trucks with 6 wheels, the data model would not need any changes.
Try it out in 5 clicks: Setting up a cluster with Couchbase Analytics
If you are new to Couchbase, you can download Couchbase Server 6.0 and try this on your own. You can choose to install Couchbase on a single machine or install a cluster. The instructions below are for adding a new node to a cluster. If you are running everything on a single machine, please ensure that data and analytics services are running on the node.
A subset of the dataset used in the demo is available for download. You will need to download and extract the demo dataset.
Use the “cbimport” utility to import this dataset in your own Couchbase 6.0 cluster. The command to do this on the Mac is:
|
1 |
/Applications/Couchbase\ Server.app/Contents/Resources/couchbase-core/bin/cbimport json -c <cluster_host_name_or_IP> -u <username> -p <password> -b cars -f lines -d file://<unzipped_list.json_file> -g "#UUID#" |
For your environment, please refer to the cbimport docs.
Now that you’ve got the readings from the cars on the road available in the operational cluster, let’s add an analytics node to the cluster to start exploring and analyzing the readings being sent in real-time. You’ll need to login to the Couchbase admin console to follow the steps below. You can also follow along with the demo video mentioned above.
- Click on “Add Server” on the top right corner of your screen.
- You’ll need to provide the details in the dialog as follows:
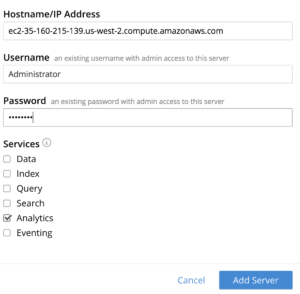
*Pro Tip for Mac users: “Option + click” will save you a bunch of clicks when selecting “Analytics” - In the same dialogue, click on the “Add Server” button
- Choose the amount of memory to assign to the Couchbase Analytics node
- Finally, click “Rebalance”
In 5 clicks, you have added a brand new service Couchbase Analytics to your cluster.
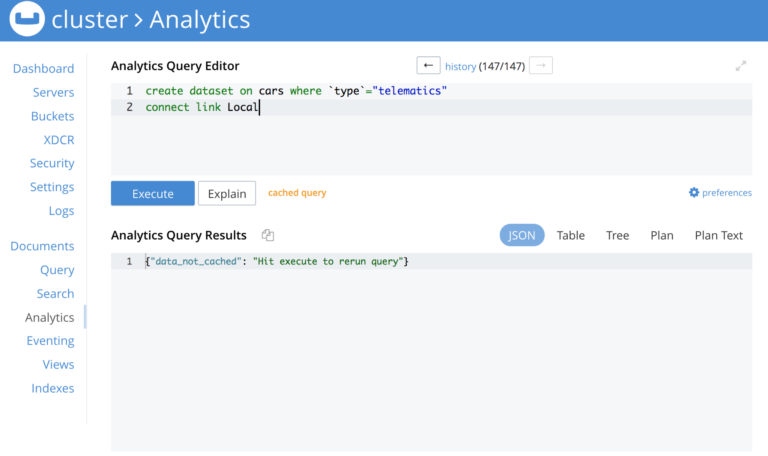
Now let’s make the operational data available for analytics by creating a shadow dataset.
|
1 2 |
create dataset on cars where `type`="telematics"; connect link Local; |
By running the above statements in the Couchbase Analytics workbench, you have now created a shadow dataset for data analysis and exploration:
Data exploration
Let’s start exploring the data. If I were the operations manager, I would like to know if the problem is widespread and if it affects more than one type of car.
|
1 2 3 4 5 |
Total # of cars with TPMS ON select * from cars where TPMS="ON" limit 1000 |
|
1 2 3 4 5 6 7 8 9 10 11 12 13 14 15 16 17 |
Types of cars having with this condition select ModelType, count(*) as count from cars where TPMS="ON" group by ModelType Sample result [ { "count": 1052, "ModelType": "Compact car" }, { "count": 1106, "ModelType": "Hybrid" } ] |
If you are a SQL developer, the queries above should be familiar. Couchbase Server enables analytics teams to bring their existing SQL skills to the schema-less and nested world of JSON data. Learn more about N1QL and SQL++.
Now let’s rule out a false positive. There may be a situation where the TPMS indicator may be sending a faulty reading but the actual tire pressure values might be ok. The actual tire pressure readings are being sent as a JSON array. Let’s check if they are actually low.
|
1 2 3 4 5 6 |
Are there any false positives? select * from cars where TPMS="ON" AND (EVERY tp in cars.TirePressure SATISFIES tp > 30) limit 1000 |
The above query returns those values where the TPMS indicator is “ON” but the actual tire pressure is above 30 psi which is the safe limit. In case you didn’t notice, the analytics engine is working off of the same JSON arrays modeled in the application so there is no transformation of data that is analyzed in its natural JSON form. #NoETLforNoSQL
SQL driver setup
Now that you’ve started exploring the data, let’s visualize it in a real-time dashboard. Most BI tools deployed in the enterprise require a SQL interface; Couchbase works with CData to provide a SQL interface. To try this out, you can download the CData driver.
In this blog post, I will create an ODBC connection to connect with Couchbase Analytics. I am using a Mac and used the ODBC Manager tool to define a System DSN with the following properties:
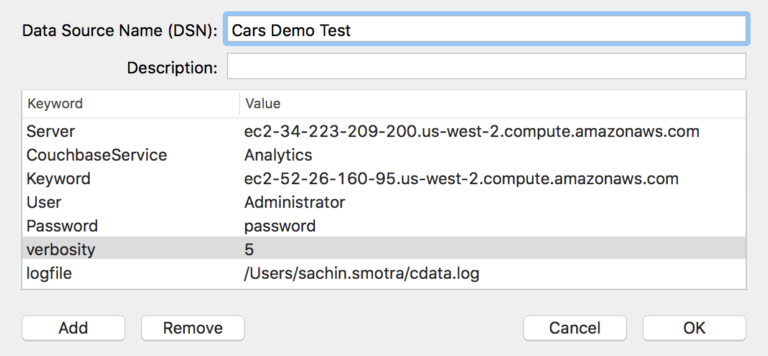
Creating a real-time visualization in Tableau
Let me now walk through the steps of connecting Tableau with Couchbase Analytics.
- Open Tableau desktop application and choose “Connect to Other Database (ODBC)”.
- Choose the option to connect using a DSN (data source name).
- Choose the DSN created in the previous step.
- Click the “Sign In” button and you will navigate to the Tableau workbook interface.
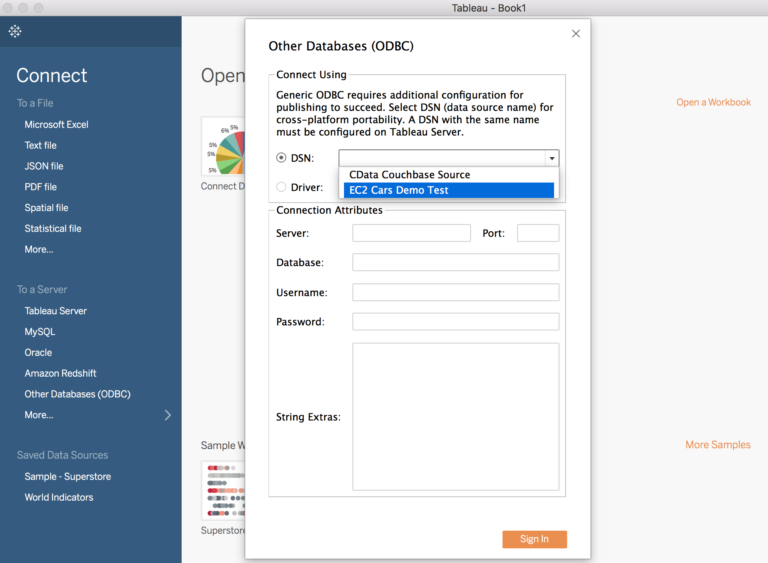
- On the left side of the screen, select “CData” as the database.
- Click on the “Select Schema” dropdown and click on the search icon and choose Couchbase.
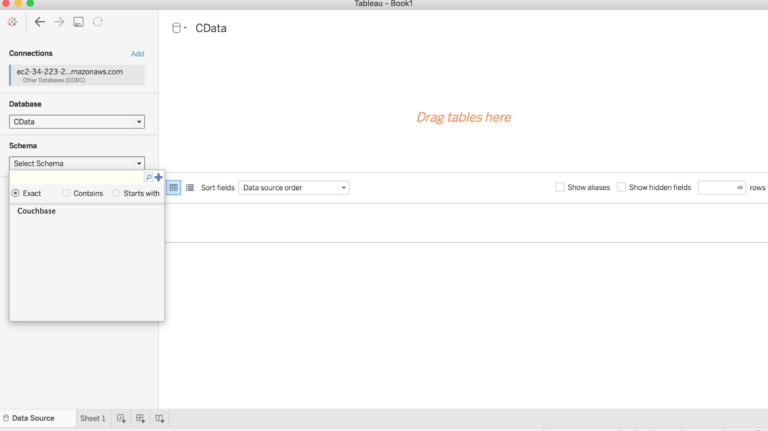
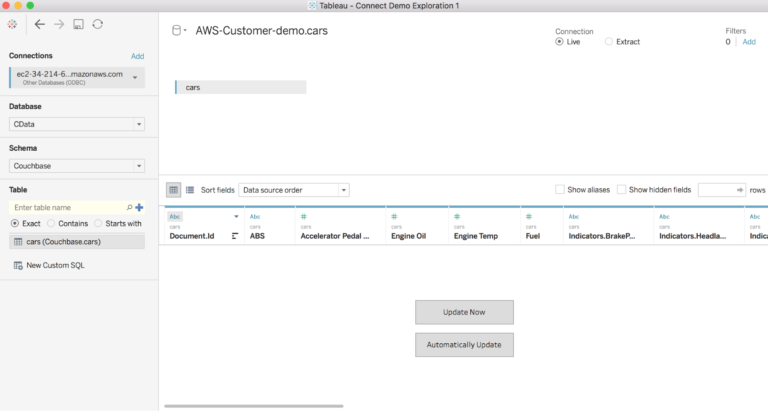
- Click on the search icon in the table section.
- Create a workbook and choose the dimension such as model type and measure for the count of distinct VIN to create a simple graph.
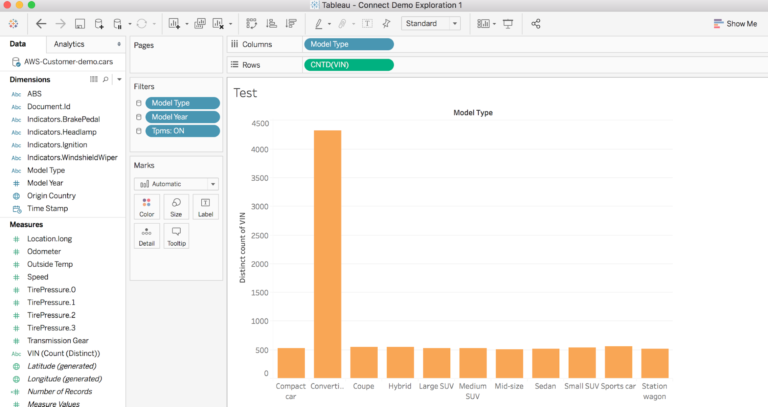
You can now enhance the basic dashboard to change the visualization and add filtering capabilities.
Conclusion
Achieving real-time operational analytics is a business imperative, but in doing so organizations face such obstacles as:
- provisioning data in legacy data architectures taking weeks, or even months
- a lack of skills required to modernize within their traditional IT department
- difficulty building business cases for modernization in the absence of a fast and direct return on investment
- limited insight due to the complexity of custom reporting and lack of operational dash-boarding.
Couchbase Analytics addresses these concerns and makes it really easy to run hybrid operational and analytical workloads in a single Couchbase cluster. The hybrid architecture in Couchbase enables real-time analysis of JSON data generated by operational applications and avoids the heavy lifting of data lakes, data warehouses, and complex ETL processes.