Co-author: Sitaram Vemulapalli, Principal Engineer, Couchbase R&D.
“The answer my friend is hiding in JSON” – Bob Dylan
There are a lot of public JSON datasets and then is awesome JSON datasets. Every company, including yours, has stored a lot of data in JSON — the result of surveys, campaigns, and forums.
There are many ways to get skin the JSON. You can write Python program for every report, visualization you want to do. Or, you can use N1QL (SQL for JSON) to generate the right algorithm for you to analyze JSON data. In this article, we show you how to use N1QL to extract insights quickly. We also use two features coming up in the next release: Common Table Expression (CTE) and Window Functions.
Goal: Use public JSON dataset for US Open golf scores to create a simple leaderboard, ranking, etc.
Three things you’ll do as part of this:
- Ingest the data into Couchbase easily.
- Start getting the value of this JSON data immediately.
- Shape the JSON to generate useful reports using new features quickly.
Source Data: https://github.com/jackschultz/usopen
Queries in this post are also available at: https://github.com/keshavmr/usopen-golf-queries
Data repo structure: This GitHub repo https://github.com/jackschultz/usopen contains US Open golf -2018 data. For each hole, it as a separate document for each day.
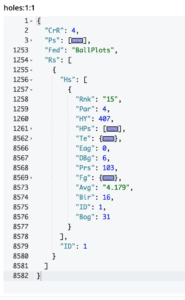
Each document has this structure. This is the document for hole 1 on day 1. The filed Ps has the list of players, each with a unique ID.
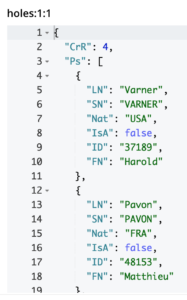
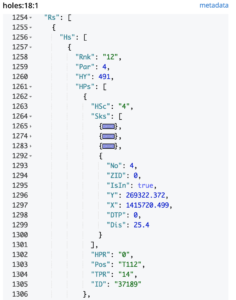
Each player’s playing statistics is following that, stroke by stroke. The players are matched to scores using the field unique ID for the player.
Start getting insights:
Before you start querying, create a primary index on the bucket.
CREATE PRIMARY INDEX ON usopen;
Task 1: Create a report of player scores by round and the final total.
After playing with JSON from bottom-up, we came up with this query. The explanation is after the query.
|
1 2 3 4 5 6 7 8 9 10 11 12 13 14 15 16 17 18 19 20 21 22 23 24 25 26 27 28 29 30 31 32 33 34 35 36 37 38 39 40 41 42 43 44 45 46 47 |
WITH d AS ( SELECT pl.hnum AS holedn, pl.ps.Nat AS country, (pl.ps.FN || " " || pl.ps.LN) AS name, pl.ps.ID AS ID, array_length(hps.Sks) AS score, hpl.hole AS `hole`, hpl.day AS `day` FROM ( SELECT meta(usopen).id AS hnum, ps FROM usopen USE keys "holes:1:1" unnest Ps AS ps ) pl INNER JOIN ( SELECT TONUMBER(split(meta(usopen).id, ":") [1]) AS `hole`, TONUMBER(split(meta(usopen).id, ":") [2]) AS `day`, hps FROM usopen unnest Rs AS rs UNNEST rs.Hs AS hs UNNEST hs.HPs AS hps ) hpl ON (pl.ps.ID = hps.ID) ) SELECT d.name, SUM( CASE WHEN d.day = 1 THEN d.score ELSE 0 END ) R1, SUM( CASE WHEN d.day = 2 THEN d.score ELSE 0 END ) R2, SUM( CASE WHEN d.day = 3 THEN d.score ELSE 0 END ) R3, SUM( CASE WHEN d.day = 4 THEN d.score ELSE 0 END ) R4, SUM(d.score) T FROM d GROUP BY d.name ORDER BY d.name |
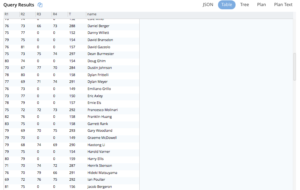
Tabular Results (In Tabular form, from the Couchbase query workbench)
Let’s look at the query block by block.
Look at the WITH d clause. The statement untangles the JSON from PER-day-PER-hole-shot-by-shot data to simple scalar values.
|
1 2 3 4 5 6 7 8 9 10 11 12 13 14 15 16 |
{ "d": { "ID": "37189", "country": "USA", "day": 1, "hole": 10, "holedn": "holes:1:1", "name": "Harold Varner", "score": 6 } } |
Holedn is the document key – hole-day-number
Country is the player’s nationality
ID is the player’s unique ID.
Hole and day are obvious and score is the player’s score for that hole.
In the FROM clause of the SELECT statement, pl is the full list of players taken from the document for the first day, first hole (holes:1:1).
Rs is the players’ result, shot by shot, hole by hole. First, we unnest that array couple of times to project details on each hole and score for that hole, determined by array_length(hps.Sks).
Once we have the hole-by-hole score, it’s easy to write the final query to aggregate by the player and by day.
|
1 2 3 4 5 6 7 8 9 10 11 12 13 |
select d.name, sum(case when d.day = 1 then d.score else 0 end) R1, sum(case when d.day = 2 then d.score else 0 end) R2, sum(case when d.day = 3 then d.score else 0 end) R3, sum(case when d.day = 4 then d.score else 0 end) R4, sum(d.score) T from d group by d.name order by d.name |
**The WITH clause is the common table expression (CTE) feature in the upcoming Mad-Hatter release. The old way to do this in Couchbase 5.5 or below is using the LET clause. Post the question in Couchbase forum if you need help here).
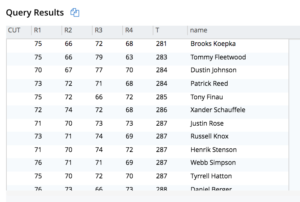
Task 2: Now, create the full leaderboard and add the CUT information. The golfers who got cut won’t play third or the fourth round. We use this information to determine the players who got cut.
Query 2. Take the previous query and name it as a common table dx and then add the following expression to determine that cut.
|
1 2 3 4 5 6 7 8 9 10 11 12 13 14 15 16 |
( CASE WHEN ( d2.R1 = 0 OR d2.R2 = 0 OR d2.R3 = 0 OR d2.R4 = 0 ) THEN "CUT" ELSE MISSING END ) AS CUT |
Here’s the full query:
|
1 2 3 4 5 6 7 8 9 10 11 12 13 14 15 16 17 18 19 20 21 22 23 24 25 26 27 28 29 30 31 32 33 34 35 36 37 38 39 40 41 42 43 44 45 46 47 48 49 50 51 52 53 54 55 56 57 58 59 60 61 62 63 64 65 66 67 |
WITH dy AS ( SELECT pl.hnum AS holedn, pl.ps.Nat AS country,(pl.ps.FN || " " || pl.ps.LN) AS name, pl.ps.ID AS ID, array_length(hps.Sks) AS score, hpl.hole AS `hole`, hpl.day AS `day` FROM ( SELECT meta(usopen).id AS hnum, ps FROM usopen USE keys "holes:1:1" unnest Ps AS ps ) pl INNER JOIN ( SELECT TONUMBER(split(meta(usopen).id, ":") [1]) AS `hole`, TONUMBER(split(meta(usopen).id, ":") [2]) AS `day`, hps FROM usopen unnest Rs AS rs unnest rs.Hs AS hs unnest hs.HPs AS hps ) hpl ON (pl.ps.ID = hps.ID) ), dx AS ( SELECT d.name, sum( CASE WHEN d.day = 1 THEN d.score ELSE 0 END ) R1, sum( CASE WHEN d.day = 2 THEN d.score ELSE 0 END ) R2, sum( CASE WHEN d.day = 3 THEN d.score ELSE 0 END ) R3, sum( CASE WHEN d.day = 4 THEN d.score ELSE 0 END ) R4, sum(d.score) T FROM dy AS d GROUP BY d.name ORDER BY d.name ) SELECT d2.name, d2.R1, d2.R2, d2.R3, d2.R4, d2.T,( CASE WHEN ( d2.R1 = 0 OR d2.R2 = 0 OR d2.R3 = 0 OR d2.R4 = 0 ) THEN "CUT" ELSE MISSING END ) AS CUT FROM dx AS d2 ORDER BY CUT ASC, d2.T ASC |
Task 3: Determine the winners.
We need to rank the players based on the total score to determine who won the tournament. The rankings are skipped over if there are ties in the scores. Doing this in SQL without window functions is expensive. Here, we write the query using the RANK() window function. Window functions are a feature in N1QL in the upcoming release (Mad-Hatter)
Query 3:
|
1 2 3 4 5 6 7 8 9 10 11 12 13 14 15 16 17 18 19 20 21 22 23 24 25 26 27 28 29 30 31 32 33 34 35 36 37 38 39 40 41 42 43 44 45 46 47 48 49 50 51 52 53 54 55 56 57 58 59 60 61 62 63 64 65 66 67 68 69 70 |
WITH dy AS ( SELECT pl.hnum AS holedn ,pl.ps.Nat AS country ,(pl.ps.FN || " " || pl.ps.LN) AS name ,pl.ps.ID AS ID ,array_length(hps.Sks) AS score ,hpl.hole AS `hole` ,hpl.day AS `day` FROM ( SELECT meta(usopen).id AS hnum ,ps FROM usopen USE keys "holes:1:1" unnest Ps AS ps ) pl INNER JOIN ( SELECT TONUMBER(split(meta(usopen).id, ":") [1]) AS `hole` ,TONUMBER(split(meta(usopen).id, ":") [2]) AS `day` ,hps FROM usopen unnest Rs AS rs unnest rs.Hs AS hs unnest hs.HPs AS hps ) hpl ON (pl.ps.ID = hps.ID) ) ,dx AS ( SELECT d.name ,sum(CASE WHEN d.day = 1 THEN d.score ELSE 0 END) R1 ,sum(CASE WHEN d.day = 2 THEN d.score ELSE 0 END) R2 ,sum(CASE WHEN d.day = 3 THEN d.score ELSE 0 END) R3 ,sum(CASE WHEN d.day = 4 THEN d.score ELSE 0 END) R4 ,sum(d.score) T FROM dy AS d GROUP BY d.name ORDER BY d.name ) SELECT d2.name ,d2.R1 ,d2.R2 ,d2.R3 ,d2.R4 ,d2.T ,RANK() OVER (ORDER BY d2.T + CUT) AS Rank FROM dx AS d2 LET CUT = ( CASE WHEN ( d2.R1 = 0 OR d2.R2 = 0 OR d2.R3 = 0 OR d2.R4 = 0 ) THEN 1000 ELSE 0 END ) ORDER BY Rank |
Notice the ranks 4, 8, 9, 10, 11 missing because of the tie scores!
Task 4: Now, let’s find out how each player fared after round1, round2, round3 compared to the final round. Using the window functions, it becomes as easy making the marshmallows covered with chocolate disappear.
Query 4: Use the same RANK() function, by ORDER BY the score of each day (day1, day1+day2, day1+day2+day3) instead of just the final score.
|
1 2 3 4 5 6 7 8 9 10 11 12 13 14 15 16 17 18 19 20 21 22 23 24 25 26 27 28 29 30 31 32 33 34 35 36 37 38 39 40 41 42 43 44 45 46 47 48 49 50 51 52 53 54 55 56 57 58 59 60 61 62 63 64 65 66 67 68 69 70 71 72 73 74 75 76 77 78 79 80 81 82 83 84 85 86 87 88 89 |
WITH dy AS ( SELECT pl.hnum AS holedn, pl.ps.Nat AS country,(pl.ps.FN || " " || pl.ps.LN) AS name, pl.ps.ID AS ID, array_length(hps.Sks) AS score, hpl.hole AS `hole`, hpl.day AS `day` FROM ( SELECT meta(usopen).id AS hnum, ps FROM usopen USE keys "holes:1:1" unnest Ps AS ps ) pl INNER JOIN ( SELECT TONUMBER(split(meta(usopen).id, ":") [1]) AS `hole`, TONUMBER(split(meta(usopen).id, ":") [2]) AS `day`, hps FROM usopen unnest Rs AS rs unnest rs.Hs AS hs unnest hs.HPs AS hps ) hpl ON (pl.ps.ID = hps.ID) ), dx AS ( SELECT d.name, sum( CASE WHEN d.day = 1 THEN d.score ELSE 0 END ) R1, sum( CASE WHEN d.day = 2 THEN d.score ELSE 0 END ) R2, sum( CASE WHEN d.day = 3 THEN d.score ELSE 0 END ) R3, sum( CASE WHEN d.day = 4 THEN d.score ELSE 0 END ) R4, sum(d.score) T FROM dy AS d GROUP BY d.name ORDER BY d.name ) SELECT d2.name, d2.R1, d2.R2, d2.R3, d2.R4, d2.T, DENSE_RANK() OVER ( ORDER BY d2.T + CUT ) AS rankMoney, RANK() OVER ( ORDER BY d2.T + CUT ) AS rankFinal, RANK() OVER ( ORDER BY d2.R1 ) AS round1rank, RANK() OVER ( ORDER BY d2.R1 + d2.R2 ) AS round2rank, RANK() OVER ( ORDER BY d2.R1 + d2.R2 + d2.R3 + CUT ) AS round3rank FROM dx AS d2 LET CUT = ( CASE WHEN ( d2.R1 = 0 OR d2.R2 = 0 OR d2.R3 = 0 OR d2.R4 = 0 ) THEN 1000 ELSE 0 END ) ORDER BY rankFinal, round1rank, round2rank, round3rank |
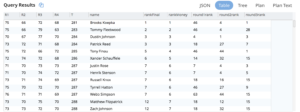
Now you can see how the players moved up or down each day.
Task 5: Create the full scorecard for the leader using the basic shot-by-shot statistics.
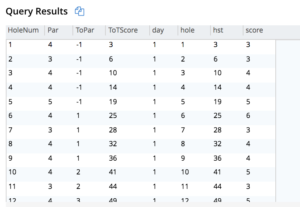
Query 5: Brooks Koepka is the final winner of the US open. Let’s get his scores, hole by hole and get the cumulative scores for him by round. Notice how the simple SUM() and the COUNT() aggregate works as a window function with the OVER() clause.
|
1 |
SUM(d2.score) OVER (PARTITION BY d2.day ORDER BY d2.hole) hst |
This first partitions the score by day and then by hole – specified by PARTITION BY clause, in the order of the holes 1-18. The SUM then adds up the scores so far.
|
1 |
SUM(d3.score) OVER (ORDER BY d3.day,d3.hole) ToTScore |
This SUM() function simply adds up the score score from day 1, hole 1 to day 4, hole 18 — this is specified by the ORDER BY d3.day, d3.hole within the OVER() clause.. The field ToTScore shows the total shorts for the tournament by Koepka at each hole.
|
1 2 3 4 5 6 7 8 9 10 11 12 13 14 15 16 17 18 19 20 21 22 23 24 25 26 27 28 29 30 31 32 33 34 35 36 37 38 39 40 41 42 43 44 45 46 47 48 49 50 51 52 53 54 55 56 57 58 59 60 61 62 63 64 65 66 67 68 69 70 71 72 73 74 75 76 77 78 79 80 81 82 83 84 85 86 87 88 |
WITH dy AS ( SELECT pl.hnum AS holedn, pl.ps.Nat AS country,(pl.ps.FN || " " || pl.ps.LN) AS name, pl.ps.ID AS ID, array_length(hps.Sks) AS score, hpl.hole AS `hole`, hpl.day AS `day`, hpl.Par AS Par FROM ( SELECT meta(usopen).id AS hnum, ps FROM usopen USE keys "holes:1:1" unnest Ps AS ps WHERE ps.LN = "Koepka" ) pl INNER JOIN ( SELECT TONUMBER(split(meta(usopen).id, ":") [1]) AS `hole`, TONUMBER(split(meta(usopen).id, ":") [2]) AS `day`, hs.Par, hps FROM usopen unnest Rs AS rs unnest rs.Hs AS hs unnest hs.HPs AS hps ) hpl ON (pl.ps.ID = hps.ID) ), dx AS ( SELECT d.name, d.day, d.score, d.hole, d.Par FROM dy AS d ORDER BY d.name ), dz AS ( SELECT d2.day, d2.hole, d2.score, SUM(d2.score) OVER ( PARTITION BY d2.day ORDER BY d2.hole ) hst, d2.Par, SUM(d2.Par) OVER ( PARTITION BY d2.day ORDER BY d2.hole ) hpr FROM dx AS d2 LET CUT = ( CASE WHEN ( d2.R1 = 0 OR d2.R2 = 0 OR d2.R3 = 0 OR d2.R4 = 0 ) THEN 1000 ELSE 0 END ) ORDER BY d2.day, d2.hole ) SELECT d3.Par, d3.day, d3.hole, d3.hst, d3.score,(d3.hst - d3.hpr) ToPar, sum(d3.score) OVER ( ORDER BY d3.day, d3.hole ) ToTScore, count(1) OVER ( ORDER BY d3.day, d3.hole ) HoleNum FROM dz AS d3 |
