In order to improve the accessibility of our stats, the Couchbase Sync Gateway 2.8 release integrates the Prometheus exporter functionality directly into Sync Gateway, reducing the steps required to setup a monitoring stack. In this post, we will discuss the background of where the stats come from and the steps for setting up the Prometheus Server and Grafana dashboard for cloud native monitoring and stats visualization.
This capability was available in Developer Preview mode in 2.8 release but then made a fully supported feature, enabled by default in 2.8.2.
This blog post generally follows the same format as the previous version of “Monitoring Couchbase Sync Gateway with Prometheus and Grafana” which discussed monitoring of Sync Gateway using a standalone Sync Gateway Prometheus exporter.
Background
Sync Gateway Stats Reporting
Sync Gateway stats are published in JSON and can be easily accessed via the _expvar endpoint which, prior to 2.8, was only exposed on the admin REST interface. As a part of version 2.8, a new metrics interface has now been added which exposes the Sync Gateway stats on a dedicated port whilst ensuring that the admin interface is still protected. The new metrics interface also exposes a new /_metrics endpoint which exposes stats in Prometheus compatible format. Below is an example of all of the stat categories available.

Prometheus
Prometheus is an open source systems monitoring and alerting platform and hosted by the Cloud Native Computing Foundation. At the core of it is the Prometheus Server that is responsible for polling “Prometheus targets” for stats and storing it as time series data. Prometheus targets are statically configured or can be discovered by Prometheus.
Grafana
Grafana is an open source data visualization and alerting platform. It supports Prometheus as a data source and can be used to build comprehensive dashboards.
Prometheus Sync Gateway
As stated earlier Prometheus needs a target to poll for stats. Prior to Sync Gateway 2.8 there was a standalone exporter which sat outside of Sync Gateway. This was a separate application which, when polled, got the expvar JSON metrics from Sync Gateway and converted these into the Prometheus format. To improve the experience going forward this is no longer necessary as the exporter has now been integrated directly into Sync Gateway, accessible on the /_metrics endpoint. This means once the config has been set Sync Gateway can directly be used as a target for Prometheus.

Deployment Architecture
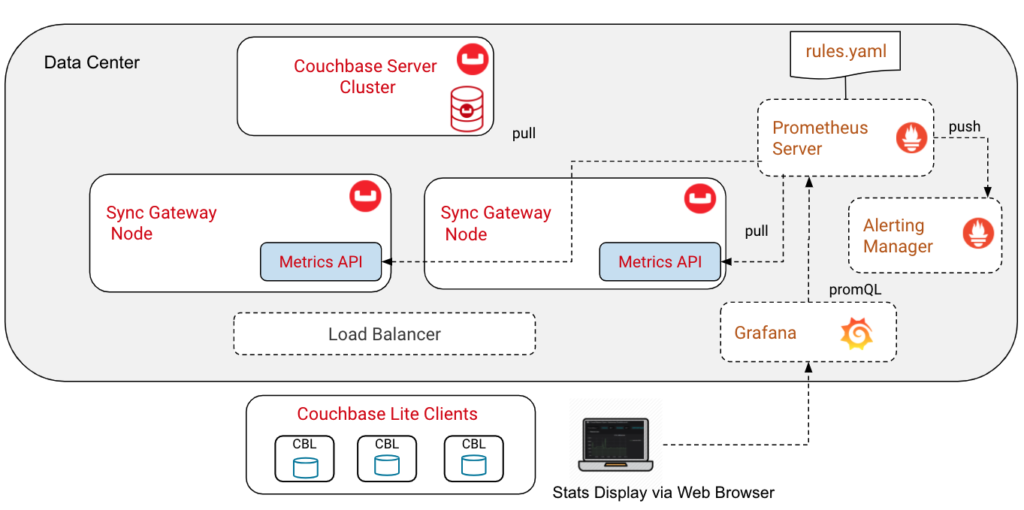
- Sync Gateway – The metrics interface can be exposed on any chosen port. The only data available on this port are the expvar stats and Prometheus stats.
- Prometheus Server will continuously poll the Sync Gateway instances for stats. The server uses the yaml files to discover the Sync Gateway instances to poll and the rules yaml to push alerts to the altering manager.
- Grafana service communicates with the Prometheus Server and queries it using the Prometheus query language (promQL) and graphis the statistics to a web based dashboard.
Setup
For the rest of this post I will walk through the steps to setup a Sync Gateway cluster with monitoring in place using Prometheus and Grafana. These instructions are intended for a development environment but can easily be modified to be suitable in a production environment.
To make this easy to set up we will be using Docker for setting up the environment, however, all of the steps should be relatively easy to translate into direct installs.
Create a Docker network
As there are multiple components and therefore multiple containers involved in this process it is recommended to run all components on the same Docker network. We will therefore create a Docker network called sgmonitoring using the following command:
|
1 |
docker network create sgmonitoring |
Setup Couchbase Server
An instance of Couchbase Server should also be set up for Sync Gateway to communicate with. In order to make the setup process easier we will use a pre-configured Docker image which contains Couchbase Server v6.0.1 with the sample travel-sample bucket and a user with the “Application Access” permission which Sync Gateway will use to connect with.
Alternatively one could install the vanilla Docker image of Couchbase Server and set up your own bucket and user manually.
|
1 |
docker run -d --name couchbase --network sgmonitoring -p 8091-8094:8091-8094 -p 11210:11210 couchbase/server-sandbox:6.5.0 |
Setup Sync Gateway
In order to set up Sync Gateway we first need to set up an appropriate config that will both connect it to our Couchbase Server instance and expose the metrics interface. The config used will be the following:
|
1 2 3 4 5 6 7 8 9 10 11 12 13 14 15 16 17 18 19 20 21 22 23 24 25 26 27 28 29 30 31 32 33 34 35 36 37 38 39 40 |
{ "interface": ":4984", "adminInterface": ":4985", "metricsInterface": ":4986", "logging": { "console": { "enabled": true, "log_level": "info", "log_keys": ["*"], "color_enabled": true }, "info": { "rotation": { "max_size": 1, "max_age": 30, "localtime": true } } }, "databases": { "travel-sample": { "users": { "admin": { "password": "password", "admin_channels": [ "*" ] } }, "server": "http://couchbase:8091", "username": "admin", "password": "password", "bucket": "travel-sample", "enable_shared_bucket_access": true, "use_views": false, "num_index_replicas": 0, "import_docs": true } } } |
Most of these config options should be relatively familiar with the only new one being metricsInterface. As previously mentioned, this option will allow both JSON expvars and the Prometheus formatted metrics to be exposed on a port separate to that of the rest of the Sync Gateway REST interfaces. By default the metrics interface is exposed on “127.0.0.1:4986” meaning its only available on localhost by default. In the above config example we have modified this to “:4986” meaning it will be exposed on any address on the 4986 port. This config can be saved anywhere but the following command will assume it is saved in your current directory as “sync-gateway-config.json”
We can then bring up our Sync Gateway instance with the following:
|
1 |
docker run -d --name sync_gateway --network sgmonitoring -p 4984-4986:4984-4986 -v `pwd`/sync-gateway-config.json:/etc/sync_gateway/sync_gateway.json` couchbase/sync-gateway:2.8.0-enterprise /etc/sync_gateway/sync_gateway.json |
To confirm that Sync Gateway is up and running and that the metricsInterface is active try to get the Prometheus stats from the endpoint accessible at http://localhost:4986/_metrics. Below is a snippet of the very bottom of the metrics on the endpoint.
Get Prometheus and Grafana Sample Config
At this point in the setup, we have a Sync Gateway instance communicating with Couchbase Server and that instance has it’s Prometheus metrics endpoint exposed.
The next couple of steps will set up the Prometheus and Grafana servers. We have pre-prepared Prometheus configuration files and an example Grafana dashboard which can be found within the examples directory of the Sync Gateway GitHub repository. This can be obtained by simply running the below command in your working directory.
|
1 |
git clone https://github.com/couchbase/sync_gateway.git |
Prometheus
We now need to set up the Prometheus Server which will read from our /_metrics endpoint.
Configure prometheus.yml file
This prometheus.yml file configures the basic setup for the Prometheus server. An example prometheus.yml file is located in the previously downloaded Sync Gateway repository inside of the examples/prometheus folder. There are a number of parameters in the file with each explained below:
|
1 2 3 |
global: scrape_interval: 5s evaluation_interval: 5s |
scrape_intervalis a parameter that specifies how often the Prometheus Server will poll the metrics endpoint.evaluation_intervalis a parameter that specifies how often rules are evaluated. Rules are further explained below.
|
1 2 |
rule_files: - '/etc/prometheus/rules/*'' |
rules_filesparameter specifies the location of the Prometheus Rules file directory. We have pre-prepared a prometheus rules file located, again, in the examples directory at examples/prometheus/rules/sync-gateway.rules.yml which must be mounted to the /etc/prometheus/rules directory as has been defined in the above configuration file. This mounting will be shown as part of the docker container setup command. The example rules file contains a few alerts and a record which will aggregate the query count into a new record called total_queries.
|
1 2 3 4 5 |
scrape_configs: - job_name: swg static_configs: - targets: - sync_gateway:4986/_metrics |
– The scrape_configs parameter here is being used to specify the targets that Prometheus will communicate with to gather stats. This specifies the target name to be ‘swg’ and this target can be polled on sync_gateway:4986/_metrics. When a part of the same Docker network we can communicate with other containers with their names, this is why sync_gateway can be used to communicate with our Sync Gateway instance.
Setup Docker Container
Navigate to the cloned sync_gateway directory and then run the below. This navigation is required to access the yaml files used in the below command, alternatively these files could be moved out into your chosen working directory.
|
1 |
docker run -d -–name prometheus –-network sgmonitoring -p 9090:9090 -v `pwd`/examples/prometheus/prometheus.yml:/etc/prometheus/prometheus.yml -v `pwd`/examples/prometheus/rules:/etc/prometheus/rules prom/prometheus |
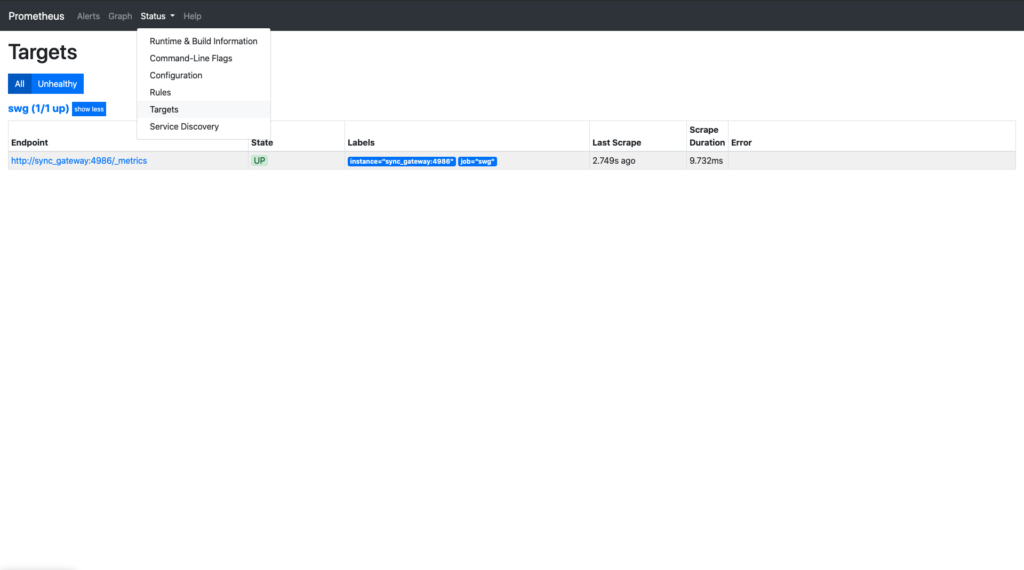
This should set up a Prometheus container with the Sync Gateway instance as a target. This can be explored by accessing http://localhost:9090 in a web browser. Ensure that the target has correctly been set up by clicking the “Status” and then “Targets” buttons. Ensure that the target is (1/1 up)
Grafana
We will now set up Grafana which will allow us to visualize the stats. Again, as mentioned previously we have pre-prepared a Grafana dashboard which shows the majority of the available stats in a way that we considered helpful, however, this is fully configurable within the web UI so you can change it to best suit your needs.
First, one needs to install the Grafana Docker image using the below command:
|
1 |
docker run -d --name grafana --network sgmonitoring -p 3000:3000 -v `pwd`/grafana/data:/var/lib/grafana grafana/grafana |
The -v flag in this command will bind the Grafana database which is used for persisting the dashboard and other relevant data. In the above command we are binding this directory to your current directory inside of a grafana/data folder, however, you can bind this somewhere else if required.
The default dashboard is available as part of the Sync Gateway repository in the examples/grafana directory. From this directory you have two options:
- Run
make grafanathis will generate the grafana dashboard.json file which can then be imported into Grafana. There are two methods to doing this: upload via browser or upload via API. - Run
make grafana-devwhich will run the above command in order to generate the dashboard.json file and will then attempt to upload the dashboard to a Grafana instance which is expected to be running on localhost:3000 as well as setup the Prometheus data source, which is expected to be running on port 3000 which container name “prometheus”.
Note that these commands require Golang and Jsonnet to be installed in order to successfully run. For more information on requirements and potential troubleshooting steps you can visit the README.
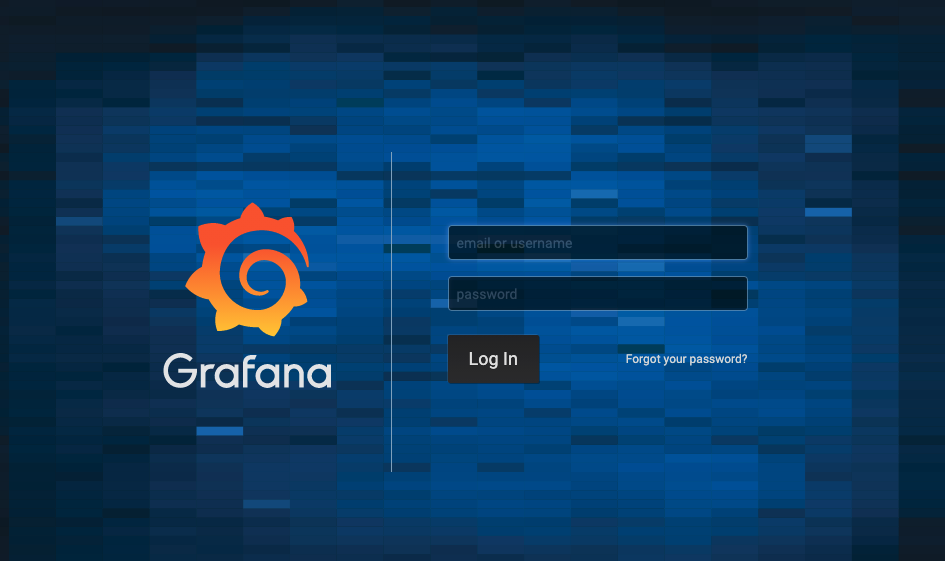
Following a successful run of the script the Sync Gateway dashboard should be available within Grafana. To check simply open up Grafana in your web browser and login. The default credentials will username “admin” and password “admin”.
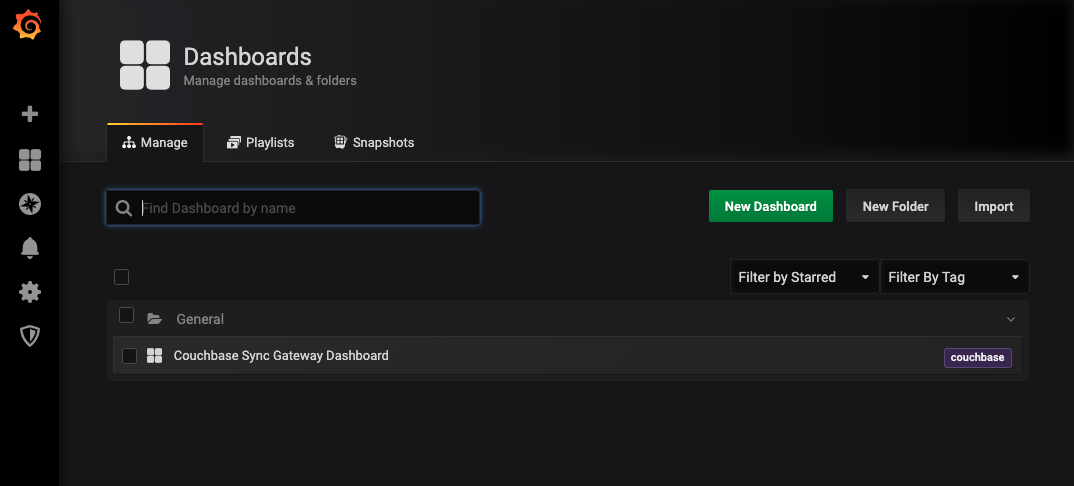
Once logged in you should be able to find “Couchbase Sync Gateway Dashboard” in the list of available dashboards.
Click on this and you will be able to see all of the different statistics that have been graphed in the default dashboard:
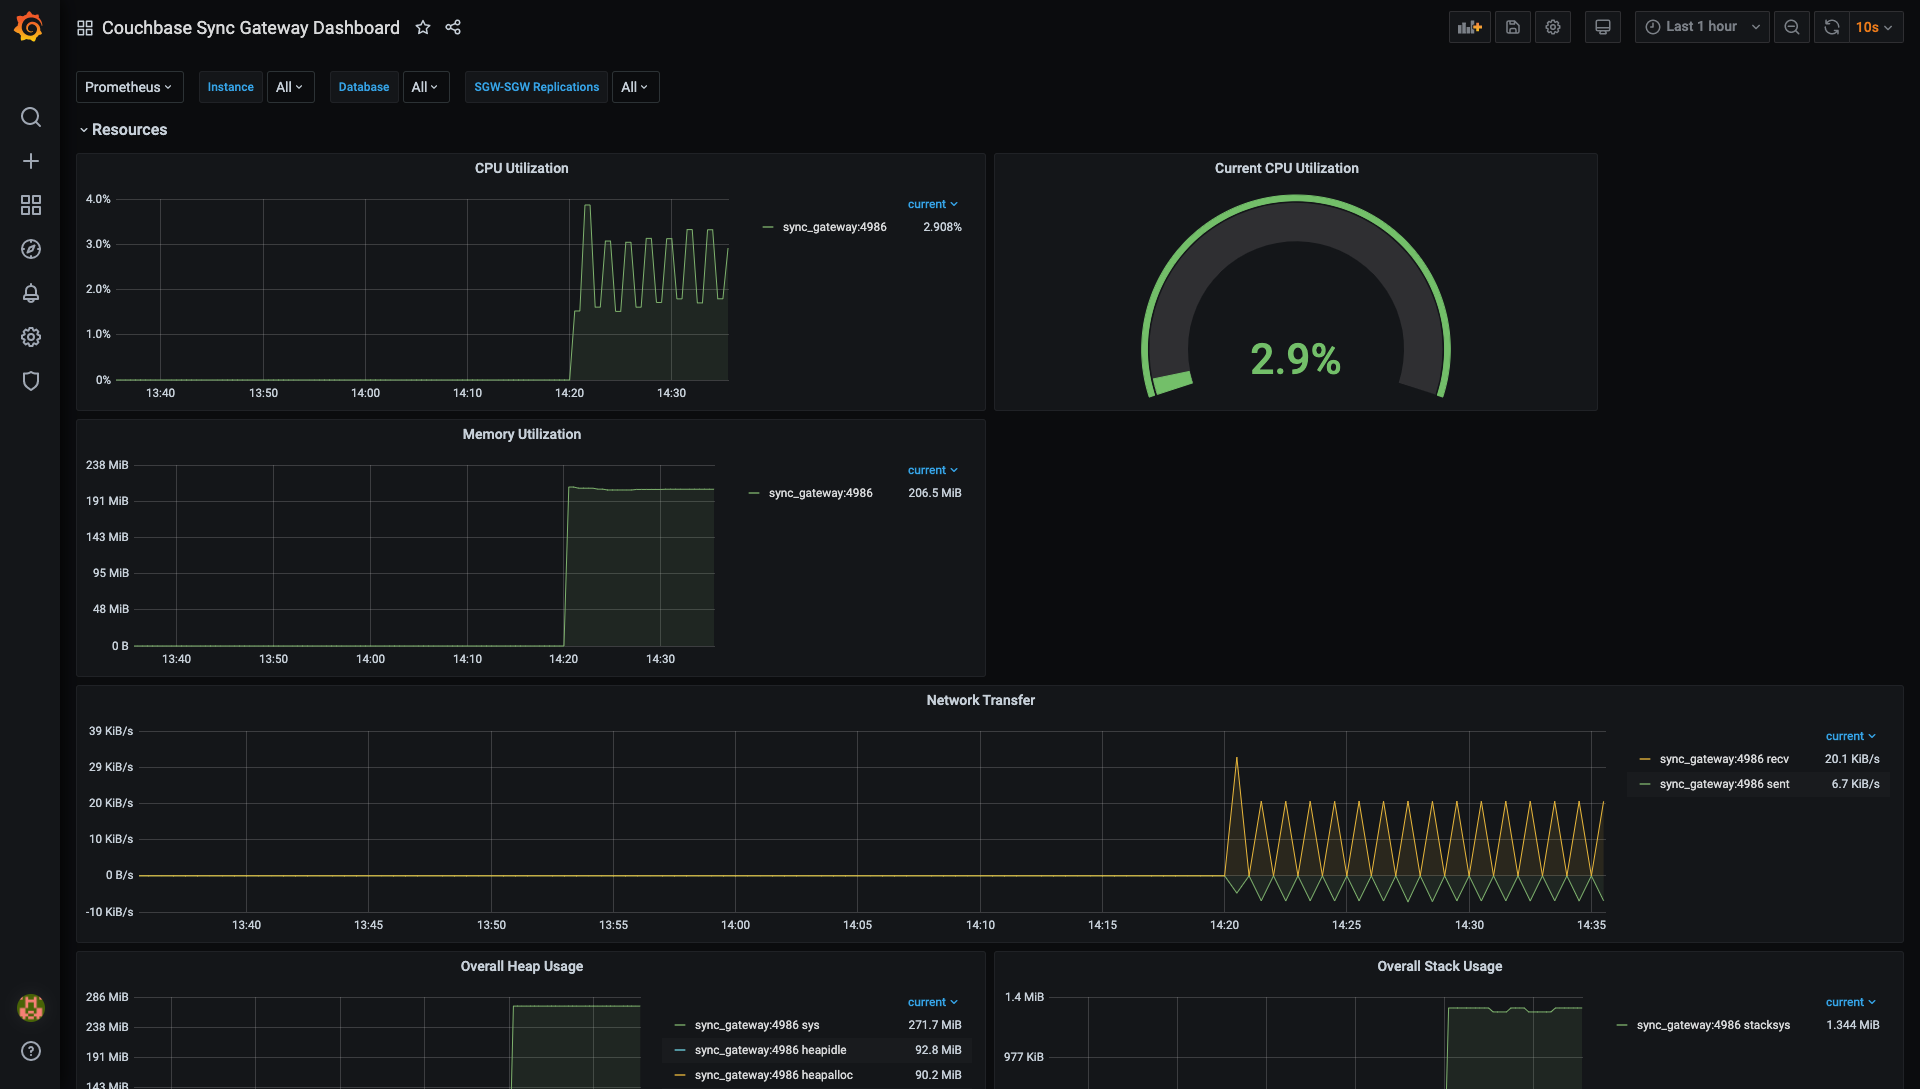
Each of the panels are fully configurable and by clicking on them you should be able to relatively easily see how that particular graph or other component is built. The dashboard, although fully functional, isn’t really intended to be used in production but is more meant as an example of what’s possible and how you can build a dashboard to better support your particular use case.
So with that you’re all done! We have successfully set up monitoring for Sync Gateway using the built in Prometheus exporter and Grafana dashboard.
Summary
The new metrics endpoint in Sync Gateway vastly simplifies monitoring of the health and status of your Sync Gateway cluster. By building the Prometheus exporter functionality directly into Sync Gateway it makes the whole process relatively easy, removing the need for a separate exporter. This is especially true in the case of cloud native environments where you can eliminate the need to deploy and manage a separate exporter container using a sidecar pattern.
We also provided the Grafana dashboard to easily show the capabilities of the Sync Gateway provided stats and Prometheus exporter. By customizing this dashboard you can adjust the graphics to better monitor the statistics applicable to your setup.
If you have any questions or feedback, please leave a comment below or feel free to contact me at jacques.rascagneres@couchbase.com