Couchbase 7.6 introduces Vector Search into the Couchbase architecture, expanding its search capabilities by leaps and bounds. This article showcases how this affects search queries, how we have to adapt in certain situations and how to efficiently use this latest feature. To make sure your vector searches are the best they can be, you need to be aware of problems like slow queries caused by inefficient indexes, inefficient queries or frequently changing data as well as other failure cases like timeouts, consistency errors, app herder, etc.
Introducing Vector Queries
Search queries had to be adapted to allow the use of vectors. It is essentially a new query type that allows similarity search instead of exact search. The difference being that we are not looking for exact matches anymore when it comes to vectors, but the closest ones to the vector specified in the query:
|
1 2 3 4 5 6 7 8 9 10 11 12 |
{ "query": { "match_none": {} }, "knn": [ { "field": "vector", "vector": [0.04603520780801773, ..., -0.08424953371286392], "k": 3 } ] } |
This is a vector query. It differs quite a bit from a regular query. All of the vector parts of the query are under a new key called knn, introduced for the sole purpose of vector queries. The k value in the query determines the number of documents you want in the results. This is necessary because instead of looking for the exact match, we are concerned about finding the k closest vectors to the query vector. This query will end up returning three vectors that search thinks is the closest to the query vector.
|
1 2 3 4 5 6 7 8 9 10 |
{ "query": “content:car”, "knn": [ { "field": "vector", "vector": [0.04603520780801773, ..., -0.08424953371286392], "k": 3 } ] } |
You can also combine a vector query with a regular query for a hybrid search. In this case, search does the query in two phases. This first phase will do the vector search, merges all of the results from the different partitions, and the second phase is where the regular search happens, utilizing the results from the first phase. This approach allows for a better performance in terms of both time and amount of data passed between the nodes.
Now that we know how to query vectors, let us go through the most common failure scenarios. What can go wrong during a vector query?
Identifying Slow Queries
One of the most common types of query failure is a slow query. A query which is stuck processing in the system for a long time is called a slow query. Depending on the timeout set for this query, it can stay running for a long time.
There are many reasons why this happens. One of the simplest reasons for a slow query is that it is too expensive to run. This can be due to it referencing too many documents, the number of documents indexed is huge or the type of query is a comparatively inefficient one.
In vector terms, the most common causes of a slow query is due to a large index size with an insufficient number of partitions, a large K value in the query, or even a high data ingest rate.
Now that we know what a slow query is, the next question that comes to mind is, how do you know there is a slow query still running? One of the best ways of doing this is to check the logs. A slow query will be logged every 5 seconds. This timer can be changed using the manager options and the log line will look like:
Another way is to look at the stats. There is a stat available in the /api/nsstats endpoint called total_queries_slow which will log the number of times a slow query has been detected:

There are also a few more stats that you can observe in the same endpoint that might give us some clue as to what is happening to the query internally and where the trouble might be:
-
- avg_grpc_internal_queries_latency – Average time taken at the grpc level for processing a query coming in from a different node
- avg_grpc_queries_latency – Average time taken at the grpc level for processing a query originating in the same node
- avg_internal_queries_latency – Average time taken for processing a query coming in from a different node
- avg_queries_latency – Average time taken for processing a query originating in the same node
Factors Contributing to Slow Queries
Now that we know how to identify a slow query, the next step is to understand why it happens and what we can do to minimize it.
Inefficient Index
One of the major factors is the index itself, the number of vectors indexed, the number of partitions, or the number of nodes. Each of these factors are crucial when it comes to query performance.
The number of vectors indexed is a pretty self explanatory factor, the more the number of vectors, the longer it will take to query them. As of 7.6.0 this can be roughly inferred from the number of documents but the following maintenance patch will have a stat which gives us the exact value.
The number of partitions and nodes can be explained somewhat intuitively. Let’s take an example of a person going through a bunch of papers on his desk.
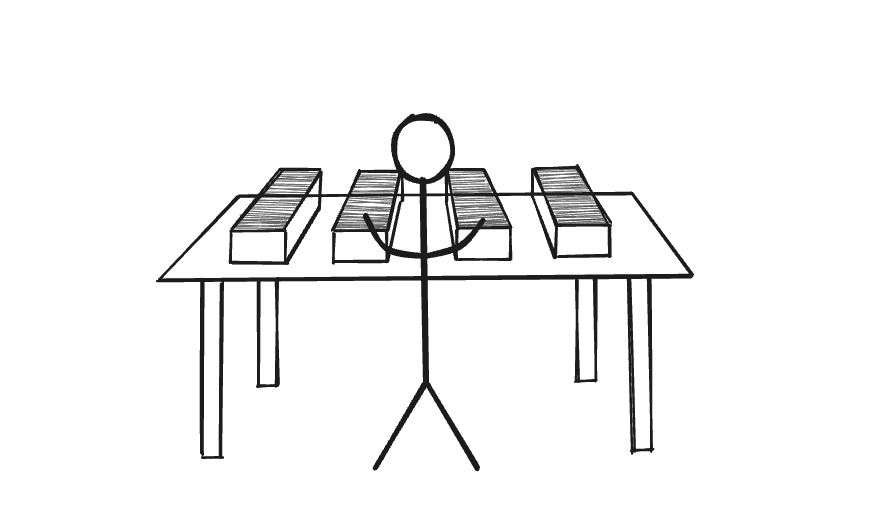
There are’s a lot of papers and only one person so it takes him longer to find what he wants. Now let’s add one more person at the same desk going through half the documents. This obviously reduces the amount of time to find the correct documents.
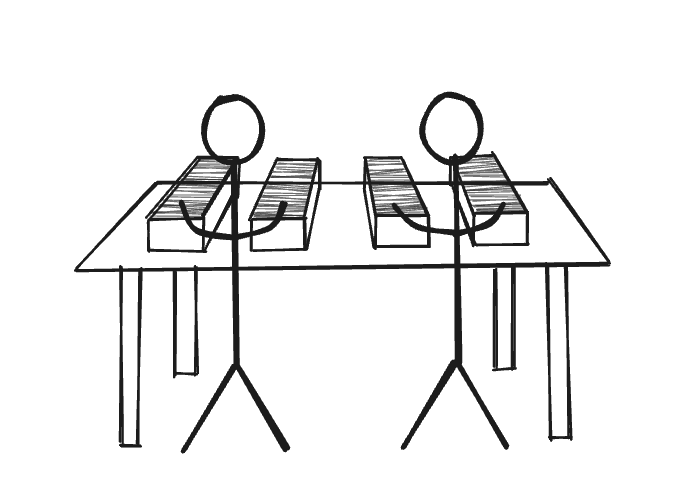
We can continue adding more people at the same desk, but after a point, you run out of desk space for the people, some of them are waiting around because the desk is too crowded.

The simplest solution is to just add another desk or get a bigger desk, this allows more people to sit down and go through the papers at once.
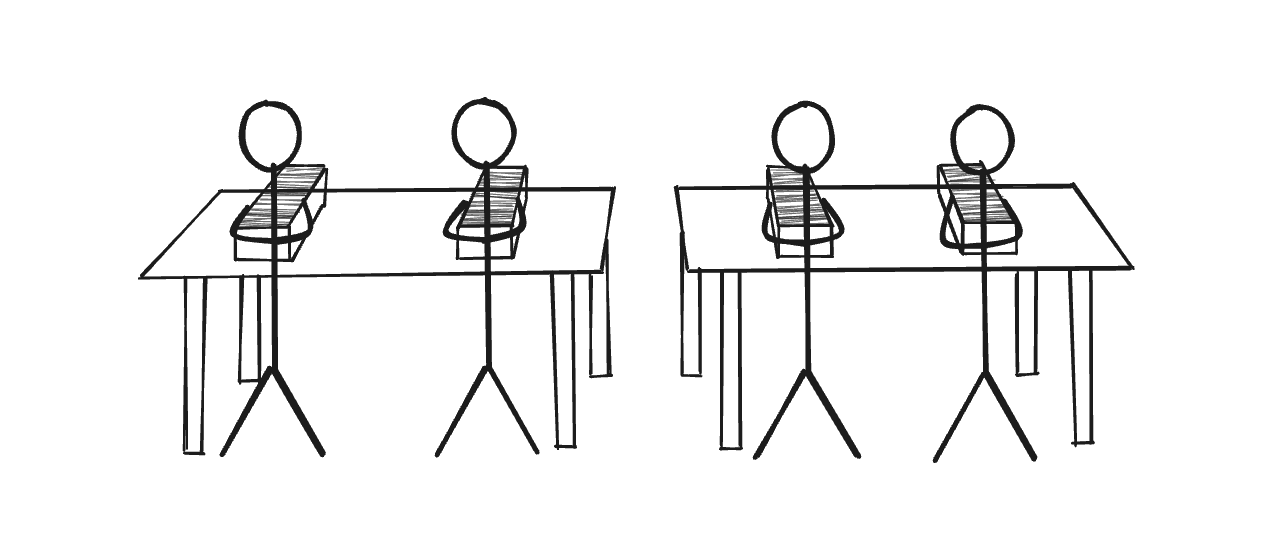
This example is similar to the search ecosystem. The people are the partitions, the papers are the vectors, the desks are the nodes. A larger number of desks mean a larger amount of resources to handle more people. More people means a faster search but too many people means more communication between them to get the results which will again be counter productive. There is a right balance to every system and it is important to find it for efficiency.
Inefficient Query
Another major factor that determines the amount of time a vector query spends in the system is the K value. A larger K value means that each index partition takes longer to process the query, a larger amount of data needs to be transferred between nodes, larger buffers needed to hold all of this data to condense each partition’s K results (total K * number of partitions worth of results) into the final K results. Each of these steps takes increasingly longer as the value of K increases.

Going back to the previous example, a large K value will mean each person will need to track a larger stack of papers, and when everyone is done, they now need to compare all of the stacks of papers they shortlisted to find the K best documents.
Constantly Changing Data
The final piece in this puzzle is the documents itself. Search follows an append only architecture. This means that every change in the document is appended and indexed and stored separately instead of rewriting the existing document entry. With a large number of changes to the actual documents, we get a very busy index with constant creation of segments and constant merging of these segments. These operations take up a lot of resources which will affect the queries as they won’t have a lot left to work with.
Think of it like having people getting you new stacks of papers while you are trying to find what you are looking for. It’s messy, you don’t have enough desk space, new papers are constantly coming in and you need to track duplicates in case it’s an updated paper.

Other Issues
Slow queries aren’t the only reason a query might fail. Some of the other failures scenarios include:
Query timeout
This is a slow query hitting the max time limit set by the user. It is caused by the same reasons as slow queries and is tracked by total_queries_timeout.
Max result window exceed
This happens when you have a query needing more hits than the maxResultWindow limit set for the cluster. This value by default is 10000 but can be configured through the manager options API. It exists to prevent accidental streaming of large amounts of data.
Partial Results
This happens when one of the partitions is unavailable and didn’t send its results to the node that received the query.
Rejected by app herder
The app herder is the final checkpointing in place to ensure that the system’s resources stay within the given limits. When a query threatens to exceed the limit, which can happen due to a large query load or indexing load or a rebalance operation or some combination of all three, app herder preemptively shuts down the query preventing its execution.
Search in context failure
This covers all of the possible errors that can happen within bleve like any issues with interacting with the index files and such.
Consistency errors
Errors in specifying the consistency parameters cause a query to fail. These parameters include the level of consistency of data, the results and other related variables.
Bad Requests
This is the simplest one which is basically user error in making a query. It could range from a typo, bad json structure to invalid query strings.
The introduction of vector search expands Couchbase’s search capabilities beyond previous boundaries and use cases. To leverage this feature effectively, users need to understand its functionalities, including querying, indexing data, and managing system behaviors under various conditions. For an even deeper understanding of vector search, its functionality, and capabilities, explore some of the other blogs on our site.
Next Steps
-
- Read more about Vector Search concepts in our blogs, including tutorials and concepts.
- Couchbase Capella’s free trial includes vector search, among many other features. Give it a try today.

Brilliant content
Very informative
Helped me to optimize my search index for my application.
Thank you Likith B