As part of Couchbase Server 7.1, we are very excited to announce the Tableau connector for Couchbase Analytics, our first business intelligence tool connector. Tableau connector allows users to quickly and easily visualize Couchbase JSON data in real-time using native connectivity to Tableau.
Faster timer to insights
Tableau BI developers and analysts who use Couchbase Analytics have been requesting the ability to perform faster visual data discovery and derive visual insights using Tableau, a popular BI and visualization tool, with native integration to Couchbase Analytics. Their key challenge was faster time to insights from Couchbase JSON data with reduced costs.
How does the Tableau connector work?
Couchbase Analytics Tableau connector works in three easy steps:
-
- Create tabular analytics views – An analytics view is a non-materialized view created on Couchbase Analytics that defines a schema and primary/foreign keys for a collection or a subquery. Learn more here.
- Download Tableau connector and driver – Click here to download the Tableau connector (taco) and JDBC driver. Follow the instructions to copy them to the appropriate folders.
- Launch Tableau Desktop – connect to Couchbase Analytics server and derive rich visual insights.
Let’s walk through an example using our travel-sample collections. Starting in Couchbase 7.1, travel-sample collections and travel-sample tabular analytics views are automatically created when you enable the Analytics Service.
Please read the accompanying guide on Travel Sample Tabular Views definitions.
Demo: Tableau connector to build visual dashboards
Let’s say business users would like to visually see the number of hotels in a country, and for each of those cities, show hotel information with the number of reviews and the average overall rating in a Tableau dashboard. Users would also like to filter hotels based on hotel amenities like free breakfast, free parking, and free Internet access. Follow along in this demo video or continue reading to get more details.
Step 1
After downloading the connector and driver as mentioned above, connect Tableau Desktop to Couchbase Analytics with the user credentials and travel-sample scope. See Fig. 1 below.

Fig. 1
Step 2
Once connected, go to the Data Source tab, select the Scope as travel-sample\inventory (if not already selected), and you will see the Analytics Views as Collections. See Fig. 2 below.

Fig. 2
Step 3
Drag the hotel_view, hotel_endorsement_view, and hotel_review_view view items and drop them on the right-hand side canvas pane. Make sure the relationships are connected with Hotel Id among hotel_view, hotel_review_view, and hotel_endorsement_view. See Fig. 3 below.

Fig. 3
Step 4 – Start Tableau worksheet
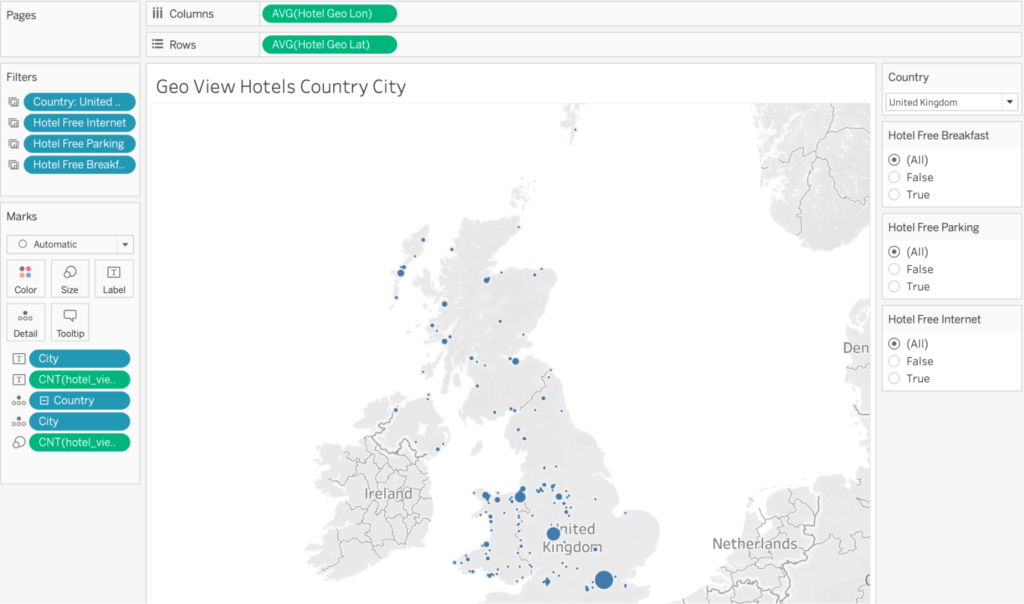
Create Sheet #1 in Tableau with a map showing the latitude and longitude of the location of the hotel using the number of hotels as the metric. Labels are the number of hotels and cities. Add filters for the country, free breakfast, free Internet, and free parking. Rename this sheet to Geo View Hotels Country City. See Fig. 4 below.

Fig. 4
Step 5
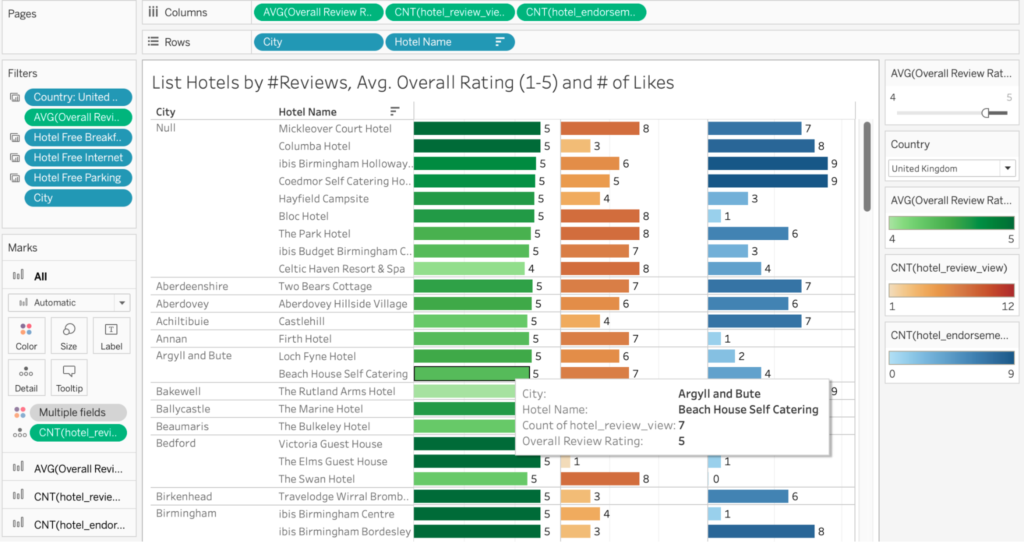
Create Worksheet #2 as a horizontal bar chart and drag the City and Hotel Name in the Rows section. Rename the measure Review Rating Overall by right-clicking on the left side pane under hotel_review_view to read Overall Review Rating. Change the default aggregation of the Overall Review Rating measure to use Average and the number format to reflect zero decimal places.
Place the metrics Hotel Review View Count, Hotel Endorsement View Count, and Overall Review Rating. Add the Country and Average Overall Review Rating as a filter and show the filter. Rename this sheet to “List Hotels by #Reviews, Avg. Overall Rating (1-5) and # of Likes”. See Fig. 5 below.

Fig. 5.
Step 6
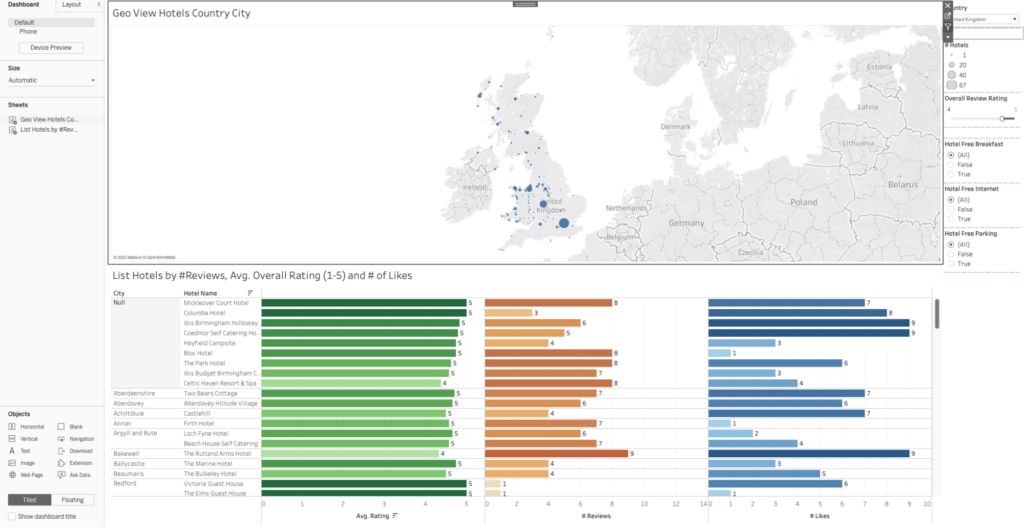
Create a new dashboard WorldWideHotelReviews Dashboard#1. Drag Geo View Hotels Country City and List Hotels by #Reviews, Avg. Overall Rating (1-5) and # of Likes and use Worksheet#1 as a Filter. See Fig. 6 below.

Fig. 6
Congratulations! Now you can derive real-time operational and visual insights with Couchbase Analytics on JSON data.
Summary
I hope you are excited about this much-desired customer request for Couchbase Analytics to be quickly and easily visualized with Tableau. You could see how one can get faster time to insights with the cost-free Tableau connector and driver to reduce your TCO. Below is a list of resources to get started with. We look forward to your feedback on the Couchbase Forums.