Tag: charts

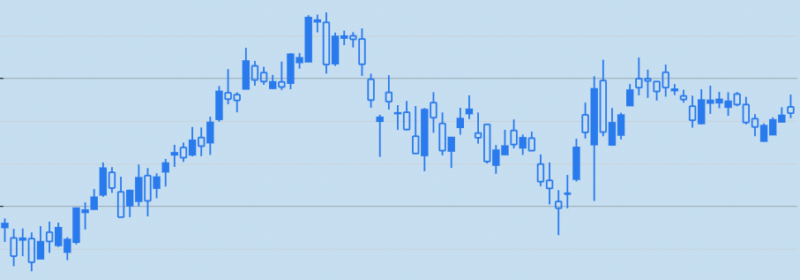
Introducing Couchbase Time Series
Couchbase is excited to announce the release of a new time-series feature as part of Couchbase 7.2. This feature is built on top of the robust Couchbase distributed database architecture, which is designed to scale horizontally as your data grows,...

Introducing Charts for Query & Analytics
Couchbase Web Console is a browser-based, interactive graphical user interface that supports the management of all services in Couchbase Server. It also includes the Query & Analytics Workbench that allows developers to interactively manipulate Couchbase data, explore the schema, and...

Announcing Analytics Developer Preview 3
Couchbase is excited to announce the availability of Couchbase Analytics Developer Preview 3 (DP3). Major Features: Rich query language: Couchbase Analytics supports SQL++, a next-generation declarative query language that has much in common with SQL. However, SQL++ includes extensions appropriate...

Taxi Ride Analysis – Native Analytics on Couchbase with Cloud9 Charts
This is a guest post by Jay Gopalakrishnan. Jay is the founder of Cloud9 Charts, an analytics platform built for modern data architectures, featuring native support for Couchbase and N1QL. Follow them on twitter @cloud9charts This post uses the NYC...