Tag: Grafana

Prometheus Monitoring of Couchbase Mobile Kubernetes Cluster
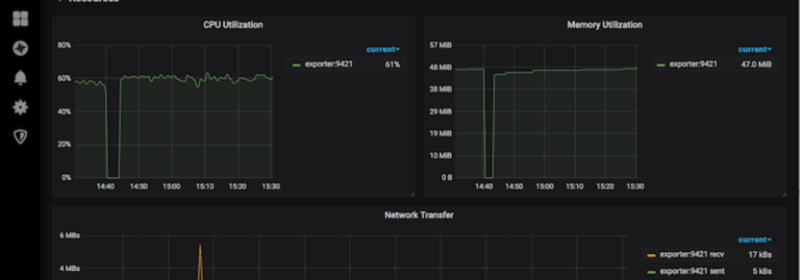
Follow this step-by-step guide to set up Prometheus for monitoring your Couchbase Sync Gateway / Mobile clusters when deployed on Kubernetes containers.

Monitor Couchbase Sync Gateway with Prometheus and Grafana
Learn how to use Prometheus, an open source platform for monitoring Couchbase Sync Gateway nodes and Grafana for visualizing the stats.
Top Posts
- Data Modeling Explained: Conceptual, Physical, Logical
- Data Analysis Methods: Qualitative vs. Quantitative Techniques
- What are Embedding Models? An Overview
- A Breakdown of Graph RAG vs. Vector RAG
- What are Vector Embeddings?
- Application Development Life Cycle (Phases and Management Models)
- Semantic Search vs. Keyword Search: What’s the Difference?
- Columnar Database Use Cases and Examples
- What Is Data Analysis? Types, Methods, and Tools for Research