Hello!
We have recently integrated the couchbase transaction tracing with our tracing.
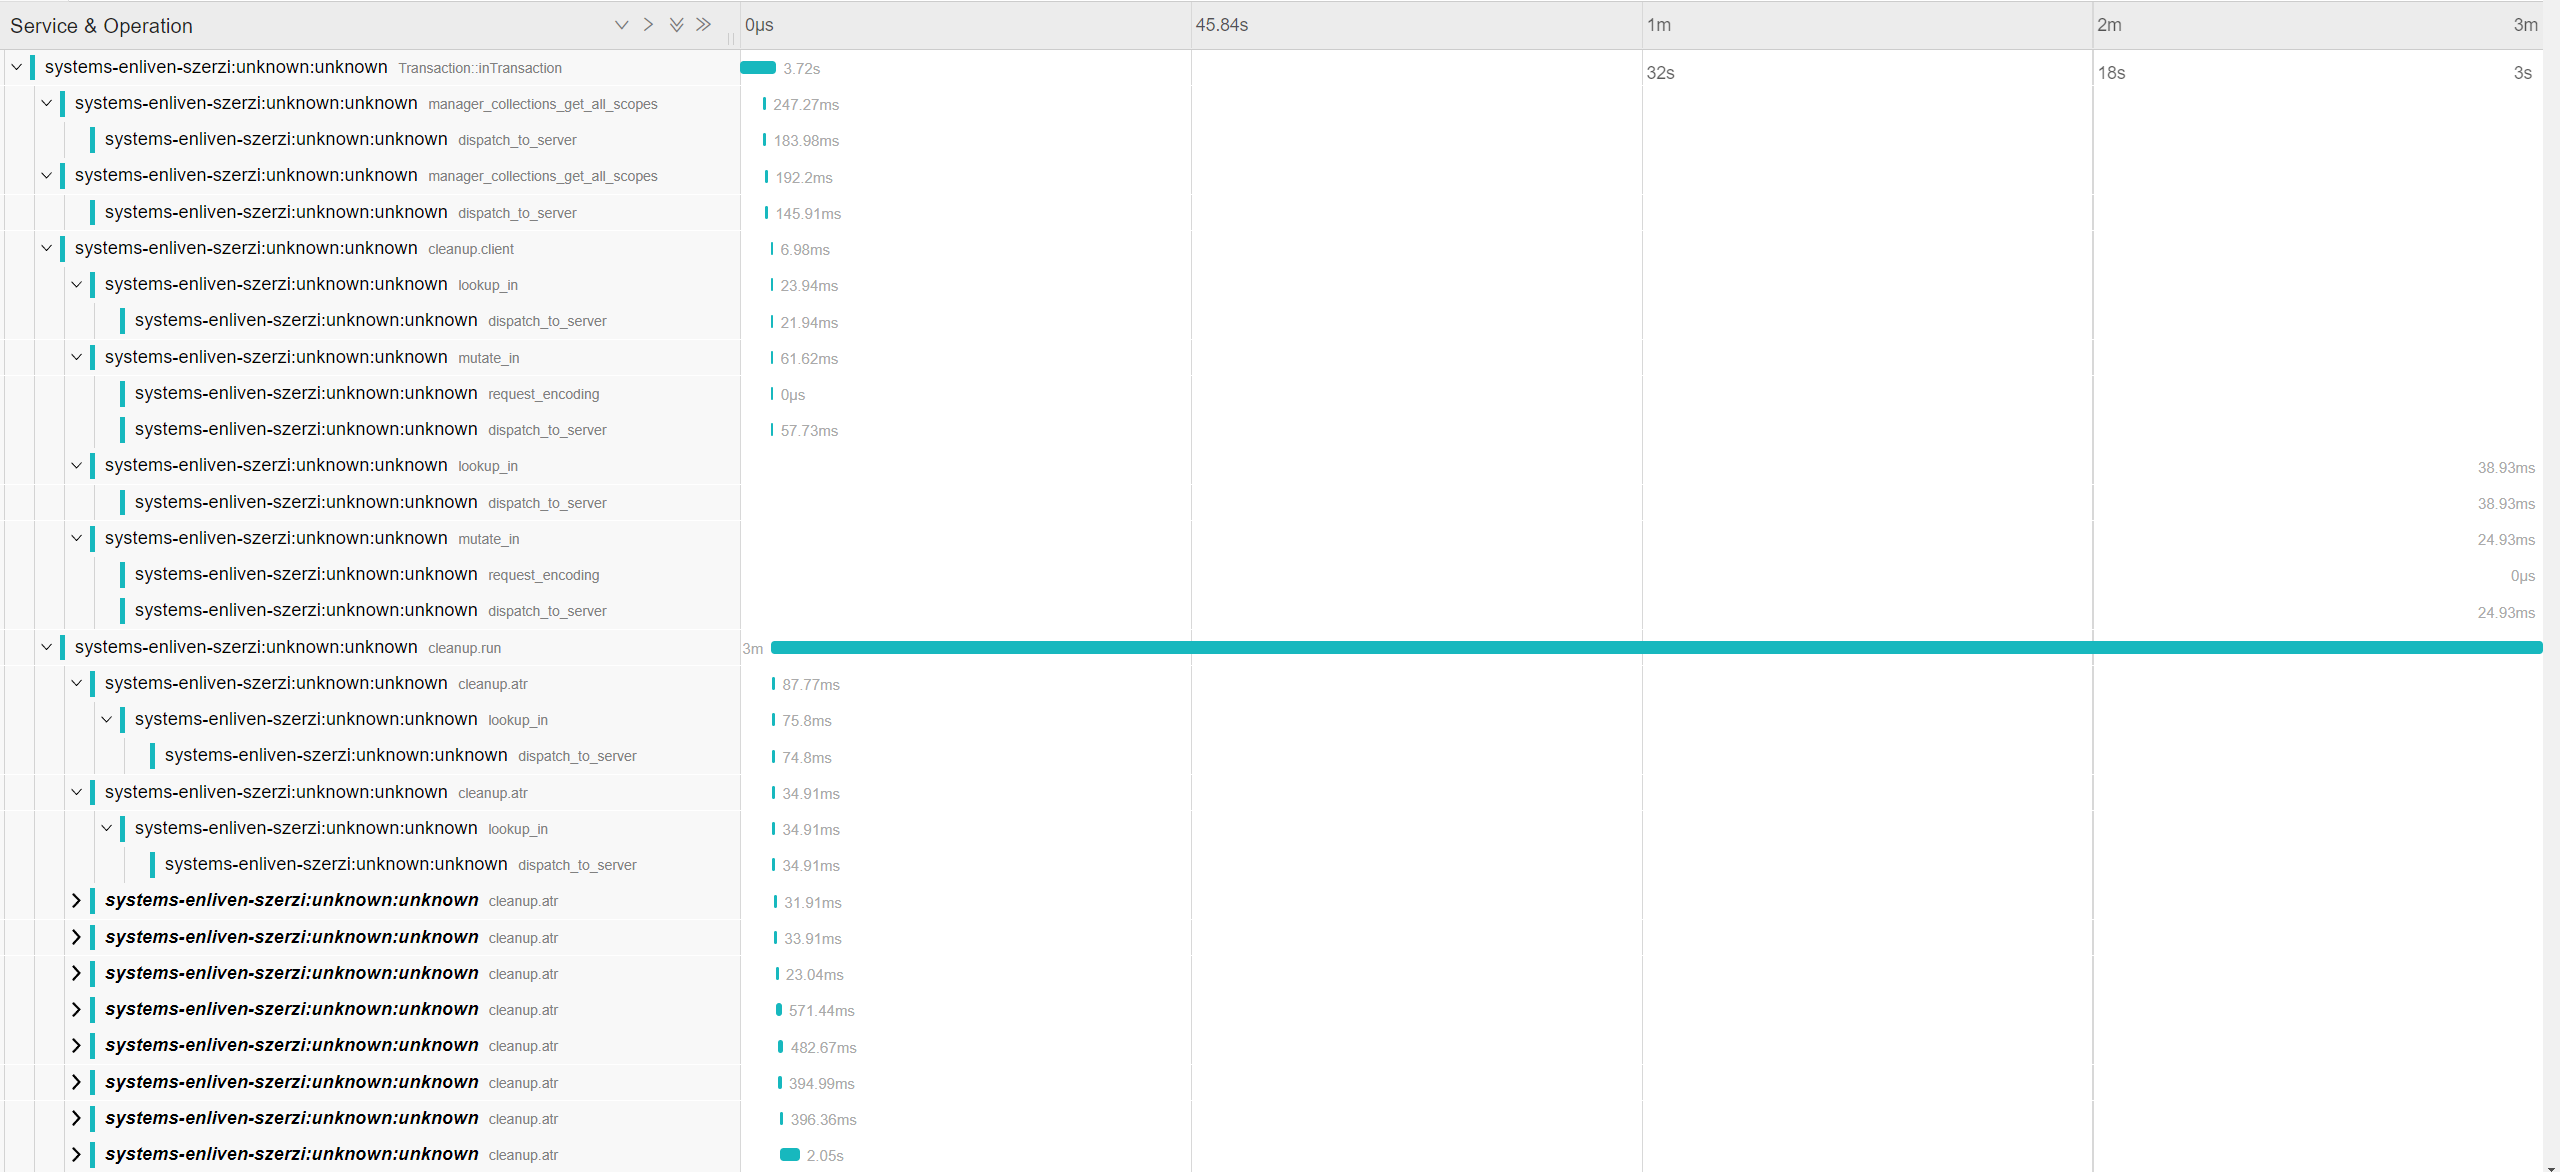
From time to time, we observed a huge trace containing over 6000 spans where the majority of these are cleanup.atr.
Trace with cleanup.run folded:
Trace with cleanup.run expanded:
Why is the cleanup.run span included in the trace? Is this because the transaction triggers the asynchronous cleanup operation? If so, is there a way to get rid of them since they are not relevant to the transaction.
Project dependencies:
- scala-client (1.2.5)
- couchbase-transactions (1.2.3)
- tracing-opentracing (1.0.5)
1 Like
Hi @horvath-martin
This is part of the asynchronous background cleanup documented here.
With default values, there is a cleanup ‘window’ every 60 seconds, for each bucket, during which each client will be checking a subset of the ATRs for expired transactions.
That window is the “cleanup.run” trace. Under that you’ll see up to 1,024 ATRs (depends how many clients you have running - the ATRs get partitioned out between them), with each doing a “cleanup.atr” span. Usually that span will just involve fetching the ATR (the lookup_in).
Usually the “cleanup.run” trace should take 60 seconds. I see some pretty high latencies there of 35 - 500 ms, so I assume you’re going over to the internet to the cluster? This will slow things down somewhat causing things to degrade gracefully, so that’s why the “cleanup.run” is taking 3 minutes rather than 1.
We have this particular tracing because cleanup is one of the most useful and essential aspects of transactions to have tracing/observability on, since it is background, distributed and non-trivial. We’ve found it helpful to have one trace per cleanup window, since it neatly groups the up-to-1,024 “cleanup.atr” spans under it.
It might be possible to configure your OpenTracing consumer to drop this trace, I’m not sure. But can I ask why you want this? Is it because the length of the trace compresses the size and hence readability of the other traces?
1 Like
@graham.pople yes, these cleanup.atr spans sneak into application traces where an application code path passes a span to the Couchbase library when it calls to a database operation. The Couchbase library possibly reactivates the span in one of the threads of its own thread pool. Then we get lookup and get database operation spans, which is great! However, possibly the thread running the cleanup.atr actives a span that it should not activate, thus, traces are not closed for a long time, and the Couchbase thread pool as stealing spans, as you said, compromises the readability of other traces. Most traces don’t contain these cleanup.atr spans, but some of them contain 1000s of these, weirdly enough.
I’m not sure I understand well enough how multi-threaded tracing works to express this problem properly. I hope it was somewhat clear or suggestive of the issue.
Is this how tracing of these cleanup.atr spans is intended? If so, and an additional 1000s of spans would not cause any trouble, it’s fine to live with this I think.
Hi @zoltan.zvara
I’m not sure I’m following… Are you saying that the “cleanup.atr” traces are somehow becoming part of application traces? I do see in the screenshots above that “cleanup.atr” is somehow listed as a child span of an application trace “Transaction::inTransaction”, which I admit confuses me. We create the “cleanup.atr” without a parent span, so it should be its own independent trace.
OpenTelemetry consumers usually provide a way to look at the raw OpenTelemetry JSON for a span. It would be worth checking the “cleanup.atr” span and seeing if it has a parent span id set. It should not, siince we are not setting one. In which case it should not be getting grouped under “Transaction::inTransaction”, AFAICT.
1 Like
@graham.pople The raw OpenTelemetry JSON shows the same relationship between spans as the screenshots:
- Transaction::inTransaction is the parent span of cleanup.run
- cleanup.run is the parent span of cleanup.atr
If this is an incorrect behavior, then maybe there is a problem in the way we provide the span to couchbase?
The span is provided to couchbase the following way:
The span is created the following way:
1 Like
@horvath-martin
The curious thing is though, that the “Transaction::inTransaction” trace absolutely should wrap the “transaction” spans that will be created by transactions.run(). But the “cleanup.atr” traces are owned by an entirely separate background thread that is created much earlier, at the Transactions.cleanup point. That thread has no awareness of this transactions.run(), they are completely decoupled.
So this continues to mystify me… I know OpenTracing has some under-the-hood thread-local storage magic with its concept of active spans - but we are on a completely different thread here…
Ah. Except we use project reactor under the hood, and the scheduler is shared. So yes, I think this must be what is happening. I don’t understand all the details yet, but OpenTracing must be automatically filling in a parent span for “cleanup.atr”, based on its active span, which it has found in thread-local storage because reactor has scheduled a cleanup operation onto the same thread just used for a transaction. Hopefully I can find a way to persuade OT not to do that. I’ve filed an internal ticket for this, and thanks for bringing it to our attention - I’ll update here when I have a solution and/or workaround.
By the way, I should call this out more explicitly in the documentation but all the current traces and spans should be regarded as a ‘volatile’ stability level. I believe it’s bug-free (apart from this newly discovered issue), but we may need to change the exact span naming and attributes down the line, once we roll this feature out fully in all the transaction implementations.
1 Like
In fact cleanup should already be using its own dedicated scheduler, and I’ve found a part of the code where this isn’t the case. I’ve fixed that now, and I’m 99% sure this is going to fix this issue since cleanup is now completely decoupled from transactions.run().
I also hope to find some time to investigate this more thoroughly and find a way to disable OpenTracing’s active span behaviour, to be sure that all top-level traces we create are safe.
1 Like
@graham.pople that’s my knowledge on the thread-local-magic of OpenTracing that whenever you create a span in a thread, it will automatically take the last activated span from that thread as the parent span. I also think that having its own dedicated scheduler will fix it.
I think this is relevant:
Note that if a Scope exists when the developer creates a new Span then it will act as its parent, unless the programmer invokes ignoreActiveSpan() at buildSpan() time or specifies parent context explicitly. [1]
[1] Spans
1 Like