Every 30 minutes we are getting a lot of traffic from the couhcbase servers

Hi,

I have a server constantly pushing and pulling objects from Couchbase at a rate of around 20-30 Mbps. Every 30 minutes, I notice a significant spike in traffic coming from Couchbase, flooding and saturating the network port. This occurs regularly, every 30 minutes, despite the absence of any scheduled job or action that might trigger large data transfers.

Could this behavior be caused by the Couchbase PHP SDK itself, perhaps as part of a cleanup process or some other internal mechanism? How can I further investigate this issue?

Thanks!

Hi flaviu - Which port? To what address? you could capture packets with wireshark.

The traffic is coming from Couchbase cluster to the consumer on port 11210

the traffic behave as a spike, flooding the network port of the consumer. Here is one example from one of the servers.

This is happening on multiple consumers from all the couchbase servers in the cluster

Also, something that is strange is that is happening on all the consumers in the same time at the same 30 minutes interval. Ttere is no cronjob/scheduler happening because there is a drift in the time this happening, one week ago was happening at 05 and 35 minute of every hour, and now is happening at 09 and 39 minute of every hour.

(a consumer is a client using the PHP SDK)

something that I see happening is that I am getting a lot of opcode=0x1 in the moment of the spike, and before the spike there is like almost 10 minutes of complete blank. not opcode=0x1 messages. and then, suddently a huge spike

[2025-04-08 09:58:13.232]    0ms [trac] [107,151] [0a7767-084c-674e-dcce-5857a83a666e78/64701a-19ab-004c-5ee1-768ad9e9d6592b/plain/bucket-redacted] <07.cb.redacted/ip-redacted:11210> MCBP recv {magic=0x82, opcode=0x1, fextlen=0, keylen=0, extlen=16, datatype=1, vbucket=0, bodylen=4897, opaque=0, cas=0}
above is the last request containing  `opcode=0x1`

......

10 minutes of missing `opcode=0x1`

......

below is the first log containing  `opcode=0x1`
[2025-04-08 10:09:17.204]   23ms [trac] [102,2228] [df6f79-3660-b14f-0488-6ef49e75045998/7f38bd-97da-db45-fa99-caa308280ab0a2/plain/bucket-redacted] <02.cb.redacted/ip-redacted:11210> MCBP recv {magic=0x82, opcode=0x1, fextlen=0, keylen=0, extlen=16, datatype=1, vbucket=0, bodylen=4897, opaque=0, cas=0}

@flaviu
opcode=0x1 are KV SETs (upserts, in the SDKs), and port 11210 is the KV port (non TLS).

The SDK would never be sending these on its own. Are you certain it’s not traffic coming from your application?

Traffic sent from the cluster to the client, that is not in response to a request from the client, is rare. The only example I can think of are the config requests that are pushed from Couchbase Server 7.6 onwards. But you shouldn’t be seeing them cause traffic spikes, and I doubt it’s these.

As Mike says - might be worth firing up Wireshark on this one. You can put “couchbase” in the filter bar to just see that traffic.

“The traffic is coming from Couchbase cluster to the consumer on port 11210”

Edit: from the traffic capture, this is ClustermapChangeNotifications. Not what I rambled on about earlier.


The data nodes listen on port 11210. The SDK connects to those ports, thus the port on the SDK will be a random port like 42638 for example. The request from the SDK will have the source port of 42638 and a destination port of 11210. The requests will have an opcode of 0x00 (Get) , 0x01 (Set) etc. Set requests will have a key and payload of the document. The response from the data node will have source port 11210, destination port 42638, the opcode will be specific to the Get/Set (I don’t know what they are offhand), the Get request will have a payload of the document. The requests/responses do not go in the opposite direction - the SDK has no listener on any port.
The only non-application initiated traffic from the SDK is to get the cluster and bucket configurations, but that would be every 2.5 seconds, not 30 minutes, and would only be one request for the cluster, and one request for each bucket. And also transaction house-keeping - I believe that is every 60 seconds.

The keys in the requests might shed some light on what that traffic is.

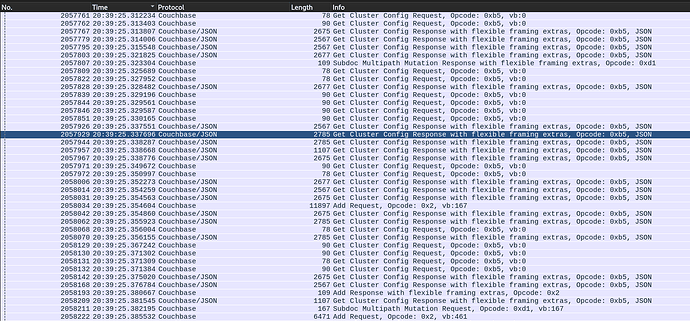
Thanks for the support, really appreciate it. Here are some more additional details from Wireshark:

Before the spike starts we see this:

After this suddently we start to receive a huge number of Opcode 0x1

and the Opcode 0x1 continue until the server ports get saturated

when the ports saturates, we start to see network re-transmission

After that things starts to settle down.

The content of the Opcode 0x1 is a cluster configuration, here is a dump

dump.json.zip (1.4 KB)

The question is, why is the Couchbase sending these (or why the SDK is requesting these every 30 minutes?

I would really appreciate some more help. I could also provide a trace from the SDK if needed.

Hmmm… this is different that I imagined. Those are indeed requests from the server to the SDK for configuration updates. ClustermapChangeNotifications does have an opcode=0x01 and a magic of 0x82 or 0x83.

is this something that could be configured somehow to not happen?

I’ve asked the server team to look.

Interesting findings @flaviu . Those ClustermapChangeNotifications you’re seeing are the pushed configs I was referring to here -

Essentially the server tells the SDK there has been a config change, and the SDK has some smarts to decide on whether it needs to fetch information about that change.

I note a lot of Get Cluster Config Requests in the first pre-spike Wireshark image - I count 15 in a window of around 70 milliseconds. I’m wondering if you have a very large number of SDK connections?

we are testing this from 2 containers, and in each container we have 2 long running processes that are permanently connected to couchbase. one is saving objects into couchbase the other is reading… probably in total there are around 200 threads

I see, and I guess each thread is creating a new Couchbase PHP Cluster object?

Cluster objects are fairly heavyweight - each will be creating multiple TCP connections, for instance - so it is usually best practice to use just one per process and share that between the threads. You’ll then be receiving much less config push traffic.

(I’ll also ping my colleague @avsej who is more well-versed with PHP and this SDK, to see if he has any concerns about this approach.)

You might want to investigate why the config is changing every 30 minutes. I don’t believe notifications are published when there are not changes. Are there rebalances? A rebalance will make a lot of changes - there can be a change for every vbucket (1024 of them).

Nobody is doing any change to the config and the cluster seems stable. Is there a place where I can see if the cluster is doing something in the bakground?