Santa Clara, Calif., – June 5, 2024 – Couchbase, Inc. (NASDAQ: BASE), the cloud database platform company, today announced financial results for its first quarter ended April 30, 2024.
“We grew ARR by 21% year-over-year, continued to increase our Capella mix, and made meaningful progress in our efforts to improve our operational rigor and efficiency,” said Matt Cain, Chair, President and CEO of Couchbase. “I’m particularly pleased that we delivered revenue and operating loss results that exceeded our outlook and delivered our first quarter of free cash flow positivity. I remain confident in our strategy and ability to achieve our objectives in fiscal 2025.”
First Quarter Fiscal 2025 Financial Highlights
- Revenue: Total revenue for the quarter was $51.3 million, an increase of 25% year-over-year. Subscription revenue for the quarter was $49.0 million, an increase of 27% year-over-year.
- Annual recurring revenue (ARR): Total ARR as of April 30, 2024 was $207.7 million, an increase of 21% year-over-year as reported and on a constant currency basis. See the section titled “Key Business Metrics” below for details.
- Gross margin: Gross margin for the quarter was 88.9%, compared to 85.6% for the first quarter of fiscal 2024. Non-GAAP gross margin for the quarter was 89.9%, compared to 86.4% for the first quarter of fiscal 2024. See the section titled “Use of Non-GAAP Financial Measures” and the tables titled “Reconciliation of GAAP to Non-GAAP Results” below for details.
- Loss from operations: Loss from operations for the quarter was $22.5 million, compared to $22.5 million for the first quarter of fiscal 2024. Non-GAAP operating loss for the quarter was $6.7 million, compared to $12.9 million for the first quarter of fiscal 2024.
- Cash flow: Cash flow provided by operating activities for the quarter was $1.6 million, compared to cash flow used in operating activities of $7.2 million in the first quarter of fiscal 2024. Capital expenditures were $1.0 million during the quarter, leading to free cash flow of $0.6 million, compared to negative free cash flow of $8.5 million in the first quarter of fiscal 2024.
- Remaining performance obligations (RPO): RPO as of April 30, 2024 was $220.0 million, an increase of 33% year-over-year.
Recent Business Highlights
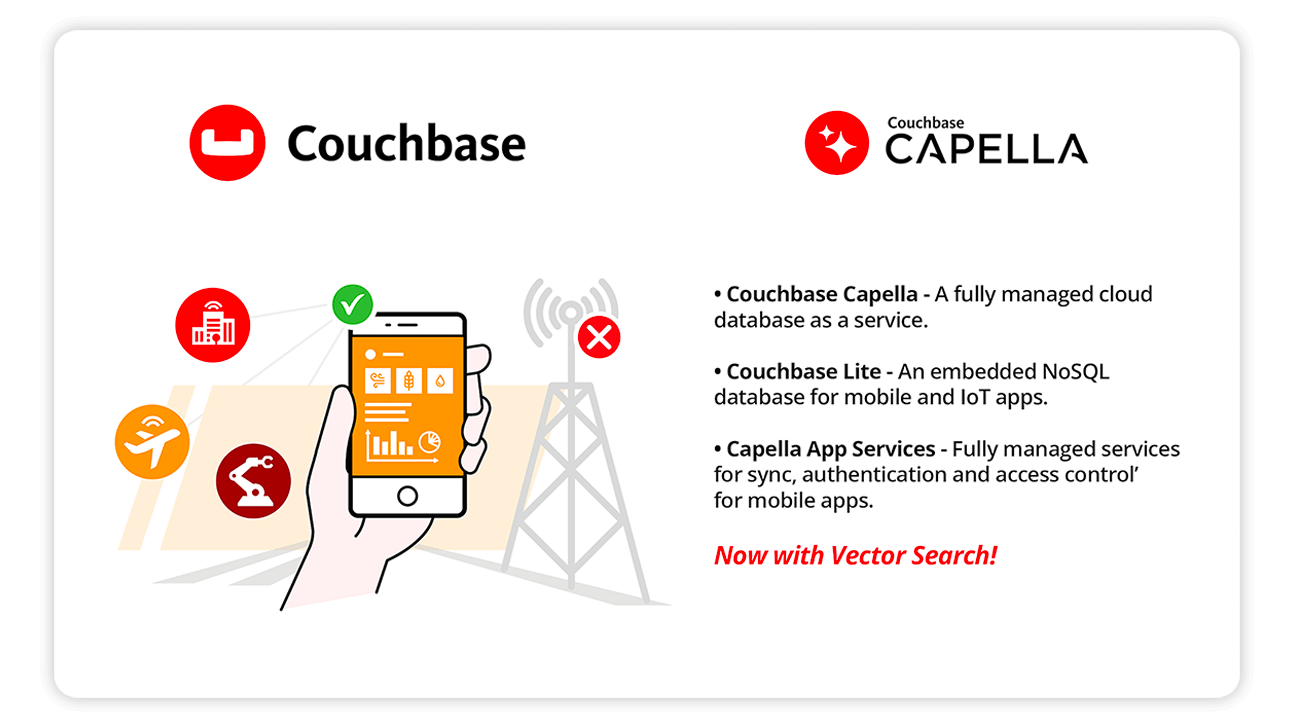
- Delivered the general availability of vector search as a feature in Couchbase Capella and the Enterprise Edition of Couchbase Server to help businesses bring to market a new class of AI-powered adaptive applications that engage users in a hyper-personalized and contextualized way. Couchbase now supports retrieval-augmented generation (RAG) techniques in the cloud and the data center, with mobile and edge in a public beta.
- Announced the appointment of Julie Irish as Couchbase’s first Chief Information Officer. In this role, Irish will lead the global IT and security team and set the strategy for systems and IT to position Couchbase’s internal infrastructure for future growth and effectiveness in alignment with the company’s key business objectives.
- Announced intent to participate in the Google Cloud Ready Distributed Cloud program, a new program that Google announced at Google Cloud Next. The new program is designed to validate partner solutions on Google Distributed Cloud (GDC), Google’s AI-ready modern infrastructure that customers run on-premises at the edge. It allows customers to quickly find and deploy solutions that have been vetted by Google specifically for running on GDC. Through the program, Couchbase will become a powerful data storage and processing option for customers on GDC, providing a scalable, flexible multi-purpose database platform running locally on standardized Google Cloud infrastructure.
- Introduced the Google Cloud Couchbase connector as part of Google Application Integration Services. The Google Cloud Couchbase connector provides a direct conduit between Couchbase Capella and Google Cloud services, allowing developers to connect to and work directly with services such as Vertex AI, making it easy to develop data-driven AI powered applications.
- Introduced the Couchbase Docs chatbot which we built on Amazon Web Services (AWS) and is powered by Amazon Bedrock for the large language model. The chatbot is the latest example of our commitment to enhancing user experience with AI.
Financial Outlook
For the second quarter and full year of fiscal 2025, Couchbase expects:
The guidance provided above is based on several assumptions that are subject to change and many of which are outside our control. If actual results vary from these assumptions, our expectations may change. There can be no assurance that we will achieve these results.
Couchbase is not able, at this time, to provide GAAP targets for operating loss for the second quarter or full year of fiscal 2025 because of the difficulty of estimating certain items excluded from non-GAAP operating loss that cannot be reasonably predicted, such as charges related to stock-based compensation expense. The effect of these excluded items may be significant.
Conference Call Information
Couchbase will host a live webcast at 1:30 p.m. Pacific Time (or 4:30 p.m. Eastern Time) on Wednesday, June 5, 2024, to discuss its financial results and business highlights. The conference call can be accessed by dialing 877-407-8029 from the United States, or +1 201-689-8029 from international locations. The live webcast and a webcast replay can be accessed from the investor relations page of Couchbase’s website at investors.couchbase.com.
About Couchbase
Modern customer experiences need a flexible database platform that can power applications spanning from cloud to edge and everything in between. Couchbase’s mission is to simplify how developers and architects develop, deploy and run modern applications wherever they are. We have reimagined the database with our fast, flexible and affordable cloud database platform Couchbase Capella, allowing organizations to quickly build applications that deliver premium experiences to their customers – all with best-in-class price performance. More than 30% of the Fortune 100 trust Couchbase to power their modern applications. For more information, visit www.couchbase.com and follow us on X (formerly Twitter) @couchbase.
Couchbase has used, and intends to continue using, its investor relations website and the corporate blog at blog.couchbase.com to disclose material non-public information and to comply with its disclosure obligations under Regulation FD. Accordingly, you should monitor our investor relations website and the corporate blog in addition to following our press releases, SEC filings and public conference calls and webcasts.
Use of Non-GAAP Financial Measures
In addition to our financial information presented in accordance with GAAP, we believe certain non-GAAP financial measures are useful to investors in evaluating our operating performance. We use certain non-GAAP financial measures, collectively, to evaluate our ongoing operations and for internal planning and forecasting purposes. We believe that non-GAAP financial measures, when taken together with the corresponding GAAP financial measures, may be helpful to investors because they provide consistency and comparability with past financial performance and meaningful supplemental information regarding our performance by excluding certain items that may not be indicative of our business, results of operations or outlook. Non-GAAP financial measures are presented for supplemental informational purposes only, have limitations as analytical tools and should not be considered in isolation or as a substitute for financial information presented in accordance with GAAP, and may be different from similarly-titled non-GAAP financial measures used by other companies. In addition, other companies, including companies in our industry, may calculate similarly-titled non-GAAP financial measures differently or may use other measures to evaluate their performance, all of which could reduce the usefulness of our non-GAAP financial measures as tools for comparison. Investors are encouraged to review the related GAAP financial measures and the reconciliation of these non-GAAP financial measures to their most directly comparable GAAP financial measures (provided in the financial statement tables included in this press release), and not to rely on any single financial measure to evaluate our business.
Non-GAAP gross profit, non-GAAP gross margin, non-GAAP operating loss, non-GAAP operating margin, non-GAAP net loss and non-GAAP net loss per share: We define these non-GAAP financial measures as their respective GAAP measures, excluding expenses related to stock-based compensation expense, employer payroll taxes on employee stock transactions, restructuring charges and impairment of capitalized internal-use software. We use these non-GAAP financial measures in conjunction with GAAP measures to assess our performance, including in the preparation of our annual operating budget and quarterly forecasts, to evaluate the effectiveness of our business strategies and to communicate with our board of directors concerning our financial performance.
Beginning with the fourth quarter of fiscal 2024, we have excluded the impairment of capitalized internal-use software, a non-cash operating expense, from our non-GAAP results as it is not reflective of ongoing operating results. This impairment charge relates to certain previously capitalized internal-use software that we determined would no longer be placed into service. Prior period non-GAAP financial measures have not been adjusted to reflect this change as we did not incur impairment of capitalized internal-use software in any prior period presented.
Free cash flow: We define free cash flow as cash used in operating activities less additions to property and equipment, which includes capitalized internal-use software costs. We believe free cash flow is a useful indicator of liquidity that provides our management, board of directors and investors with information about our future ability to generate or use cash to enhance the strength of our balance sheet and further invest in our business and pursue potential strategic initiatives.
Please see the reconciliation tables at the end of this press release for the reconciliation of GAAP and non-GAAP results.
Key Business Metrics
We review a number of operating and financial metrics, including ARR, to evaluate our business, measure our performance, identify trends affecting our business, formulate business plans and make strategic decisions.
We define ARR as of a given date as the annualized recurring revenue that we would contractually receive from our customers in the month ending 12 months following such date. Based on historical experience with customers, we assume all contracts will be renewed at the same levels unless we receive notification of non-renewal and are no longer in negotiations prior to the measurement date. For Capella products, ARR in a customer’s initial year is calculated as the greater of: (i) initial year contract revenue as described above or (ii) annualized prior 90 days of actual consumption; and ARR for subsequent years is calculated with method (ii). ARR excludes services revenue.
Prior to fiscal 2025, ARR excluded on-demand revenue and, for Capella products in a customer’s initial year, ARR was calculated solely on the basis of initial year contract revenue. The reason for these changes is to better reflect ARR where usage rates or timing of purchases may be uneven and to better align with how ARR is used to measure the performance of the business. ARR for prior periods has not been adjusted to reflect this change as it is not material to any period previously presented.
ARR should be viewed independently of revenue, and does not represent our revenue under GAAP on an annualized basis, as it is an operating metric that can be impacted by contract start and end dates and renewal dates. ARR is not intended to be a replacement for forecasts of revenue. Although we seek to increase ARR as part of our strategy of targeting large enterprise customers, this metric may fluctuate from period to period based on our ability to acquire new customers, expand within our existing customers and consumption dynamics. We believe that ARR is an important indicator of the growth and performance of our business.
We also attempt to represent the changes in the underlying business operations by eliminating fluctuations caused by changes in foreign currency exchange rates within the current period. We calculate constant currency growth rates by applying the applicable prior period exchange rates to current period results.
Forward-Looking Statements
This press release contains “forward-looking” statements within the meaning of the Private Securities Litigation Reform Act of 1995 that are based on management’s beliefs and assumptions and on information currently available to management. Forward-looking statements include, but are not limited to, quotations of management, the section titled “Financial Outlook” above and statements about Couchbase’s market position, strategies and potential market opportunities. Forward-looking statements generally relate to future events or our future financial or operating performance. Forward-looking statements include all statements that are not historical facts and, in some cases, can be identified by terms such as “anticipate,” “expect,” “intend,” “plan,” “believe,” “continue,” “could,” “potential,” “remain,” “may,” “might,” “will,” “would” or similar expressions and the negatives of those terms. However, not all forward-looking statements contain these identifying words. Forward-looking statements involve known and unknown risks, uncertainties and other factors, including factors beyond our control, which may cause our actual results, performance or achievements to be materially different from any future results, performance or achievements expressed or implied by the forward-looking statements. These risks include, but are not limited to: our history of net losses and ability to achieve or maintain profitability in the future; our ability to continue to grow on pace with historical rates; our ability to manage our growth effectively; intense competition and our ability to compete effectively; cost-effectively acquiring new customers or obtaining renewals, upgrades or expansions from our existing customers; the market for our products and services being relatively new and evolving, and our future success depending on the growth and expansion of this market; our ability to innovate in response to changing customer needs, new technologies or other market requirements, including new capabilities, programs and partnerships and their impact on our customers and our business; our limited operating history, which makes it difficult to predict our future results of operations; the significant fluctuation of our future results of operations and ability to meet the expectations of analysts or investors; our significant reliance on revenue from subscriptions, which may decline and, the recognition of a significant portion of revenue from subscriptions over the term of the relevant subscription period, which means downturns or upturns in sales are not immediately reflected in full in our results of operations; and the impact of geopolitical and macroeconomic factors. Further information on risks that could cause actual results to differ materially from forecasted results are included in our filings with the Securities and Exchange Commission that we may file from time to time, including those more fully described in our Annual Report on Form 10-K for the fiscal year ended January 31, 2024. Additional information will be made available in our Quarterly Report on Form 10-Q for the quarter ended April 30, 2024 that will be filed with the Securities and Exchange Commission, which should be read in conjunction with this press release and the financial results included herein. Any forward-looking statements contained in this press release are based on assumptions that we believe to be reasonable as of this date. Except as required by law, we assume no obligation to update these forward-looking statements, or to update the reasons if actual results differ materially from those anticipated in the forward-looking statements.
Investor Contact:
Edward Parker
ICR for Couchbase
IR@couchbase.com
Media Contact:
Amber Winans
Bhava Communications for Couchbase
CouchbasePR@couchbase.com
Couchbase, Inc.
Condensed Consolidated Statements of Operations
(in thousands, except per share data)
(unaudited)
Couchbase, Inc.
Condensed Consolidated Balance Sheets
(in thousands)
(unaudited)
Couchbase, Inc.
Condensed Consolidated Statements of Cash Flows
(in thousands)
(unaudited)
Couchbase, Inc.
Reconciliation of GAAP to Non-GAAP Results
(in thousands, except per share data)
(unaudited)
Couchbase, Inc.
Key Business Metrics
(in millions)
(unaudited)
About Couchbase
Modern customer experiences need a flexible database platform that can power applications spanning from cloud to edge and everything in between. Couchbase’s mission is to simplify how developers and architects develop, deploy and run modern applications wherever they are. We have reimagined the database with our fast, flexible and affordable cloud database platform Capella, allowing organizations to quickly build applications that deliver premium experiences to their customers — all with best-in-class price performance. More than 30% of the Fortune 100 trust Couchbase to power their modern applications. For more information, visit www.couchbase.com and follow us on X (formerly Twitter) @couchbase.
Media Contact
James Kim
Couchbase Communications
couchbasePR@Couchbase.com
(650) 417-7500